Note
Click here to download the full example code
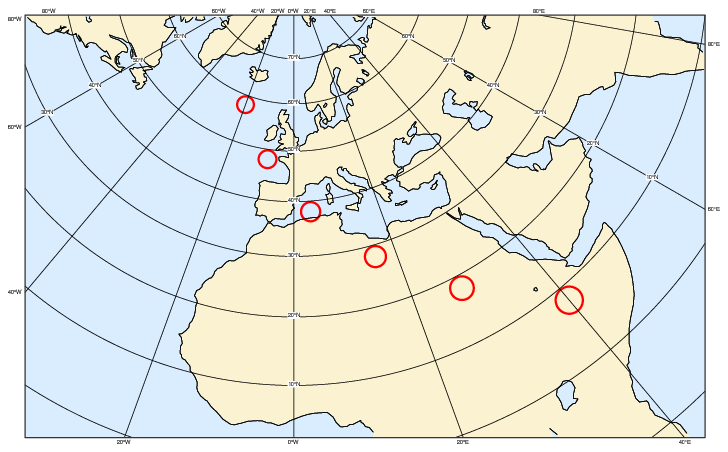
Geocircle on Map
# (C) Copyright 2017- ECMWF.
#
# This software is licensed under the terms of the Apache Licence Version 2.0
# which can be obtained at http://www.apache.org/licenses/LICENSE-2.0.
#
# In applying this licence, ECMWF does not waive the privileges and immunities
# granted to it by virtue of its status as an intergovernmental organisation
# nor does it submit to any jurisdiction.
#

import metview as mv

# ---------------------------------------------------------------
# Demonstrates how to plot a circle on any map projection using
# mvl_geocircle().
# ---------------------------------------------------------------

# set up the shaded coastlines
land_sea_shade = mv.mcoast(
    map_coastline_land_shade="on",
    map_coastline_land_shade_colour="RGB(0.98,0.95,0.82)",
    map_coastline_sea_shade="on",
    map_coastline_sea_shade_colour="RGB(0.85,0.93,1)",
)

# define the geographic view
view = mv.geoview(
    map_projection="polar_stereographic",
    map_area_definition="corners",
    area=[-5, -30, 10, 84],  # S,W,N,E
    coastlines=land_sea_shade,
)

# define the radius of the circles (in km)
circle_radius = 200

# the circle will be made up of this many segments
circle_resolution = 80

# define the centres of the circles
latPos = [58, 48, 38, 28, 18, 8]
lonPos = [-20, -8, 4, 16, 28, 40]

# build the plot the finition of the circles
plt_lst = []
for i in range(0, len(latPos)):

    # define the cirle around the specifed coordinates
    iv_circle = mv.mvl_geocircle(latPos[i], lonPos[i], circle_radius, circle_resolution)

    # define the plotting attributes for the circle
    graph_circle = mv.mgraph(
        graph_line_colour="red", graph_line_thickness="4", graph_line_style="solid"
    )

    # collect the plot definitions into a list
    plt_lst.append([iv_circle, graph_circle])

# define the output plot file
mv.setoutput(mv.pdf_output(output_name="geocircle_on_map"))

# plot the circles on the map
mv.plot(view, plt_lst)