Note
Click here to download the full example code
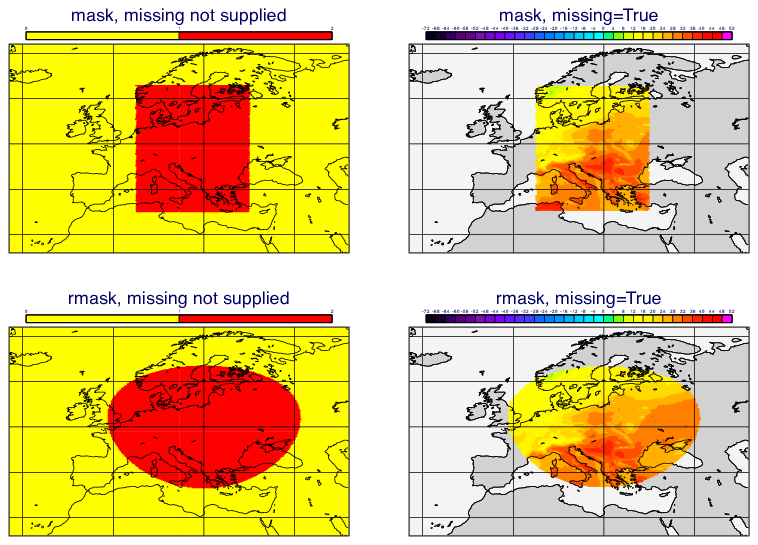
GRIB - Masking
# (C) Copyright 2021- ECMWF.
#
# This software is licensed under the terms of the Apache Licence Version 2.0
# which can be obtained at http://www.apache.org/licenses/LICENSE-2.0.
#
# In applying this licence, ECMWF does not waive the privileges and immunities
# granted to it by virtue of its status as an intergovernmental organisation
# nor does it submit to any jurisdiction.
#

# ----------------------------------------------------------
# Demonstrates the different masking functions for GRIB data
# ----------------------------------------------------------

import metview as mv

# read the input grib file
filename = "t_O640.grib"
if mv.exist(filename):
    data = mv.read(filename)
else:
    data = mv.gallery.load_dataset(filename)


# define the masking areas
mask_area = [35, 5, 63, 30]  # S,W,N,E
rmask_area = [50, 20, 1500 * 1000]  # lat,lon,radius-in-m

# create four masks
#  - using lat/lon area bounds and using radius in metres
#  - generating 1s and 0s, and generating real values and missing values
masked_bounds_1_0s = mv.mask(data, mask_area)
masked_bounds_miss = mv.mask(data, mask_area, missing=True)
masked_radius_1_0s = mv.rmask(data, rmask_area)
masked_radius_miss = mv.rmask(data, rmask_area, missing=True)


# contouring for temperature values
t_contouring = mv.mcont(
    contour_automatic_setting="style_name",
    contour_style_name="sh_all_fM64t52i4",
    legend="on",
    grib_scaling_of_derived_fields="on",
)

# contouring for 0 and 1 values
mask_1_and_0_contouring = mv.mcont(
    legend="on",
    contour="off",
    contour_level_selection_type="level_list",
    contour_level_list=[0, 1, 2],
    contour_shade="on",
    contour_shade_technique="grid_shading",
    contour_shade_max_level_colour="red",
    contour_shade_min_level_colour="yellow",
)

# set up the coastlines
coast = mv.mcoast(
    map_coastline_resolution="medium",
    map_coastline_land_shade="on",
    map_coastline_land_shade_colour="RGB(0.8235,0.8235,0.8235)",
    map_coastline_sea_shade="on",
    map_coastline_sea_shade_colour="RGB(0.9569,0.9569,0.9569)",
    map_label="off",
)

# set up the geographical area to view
gview = mv.geoview(
    map_area_definition="corners", area=[26, -23, 72, 52], coastlines=coast
)

# utility function to return a title object
def t(text):
    return mv.mtext(text_line_1=text, text_font_size=0.75)


dw = mv.plot_superpage(pages=mv.mvl_regular_layout(gview, 2, 2, 1, 1))


# define the output plot file
mv.setoutput(mv.pdf_output(output_name="masking"))

# plot an example of mask and rmask, with and without the 'missing' flag
mv.plot(dw[0], masked_bounds_1_0s, mask_1_and_0_contouring, t("mask, missing not supplied"),
        dw[1], masked_bounds_miss, t_contouring, t("mask, missing=True"),
        dw[2], masked_radius_1_0s, mask_1_and_0_contouring, t("rmask, missing not supplied"),
        dw[3], masked_radius_miss, t_contouring, t("rmask, missing=True"))