Note
Click here to download the full example code
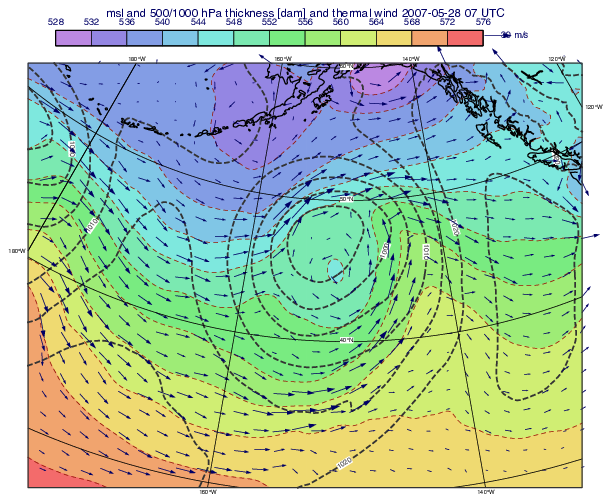
GRIB - Thermal Wind
# (C) Copyright 2017- ECMWF.
#
# This software is licensed under the terms of the Apache Licence Version 2.0
# which can be obtained at http://www.apache.org/licenses/LICENSE-2.0.
#
# In applying this licence, ECMWF does not waive the privileges and immunities
# granted to it by virtue of its status as an intergovernmental organisation
# nor does it submit to any jurisdiction.
#

import metview as mv

# getting data
use_cds = False

filename = "thw_era5.grib"

if use_cds:
    import cdsapi

    c = cdsapi.Client()
    area = [80, 160, 25, -100]
    filename_sfc = filename + ".part1"
    filename_pl = filename + ".part2"
    d = mv.date("2007-05-28 07:00:00")

    c.retrieve(
        "reanalysis-era5-single-levels",
        {
            "product_type": "reanalysis",
            "format": "grib",
            "variable": [
                "mean_sea_level_pressure",
            ],
            "year": d.date().year,
            "month": d.date().month,
            "day": d.date().day,
            "time": d.time().hour,
            "area": area,
        },
        filename_sfc,
    )

    c.retrieve(
        "reanalysis-era5-pressure-levels",
        {
            "product_type": "reanalysis",
            "format": "grib",
            "variable": ["geopotential", "u_component_of_wind", "v_component_of_wind"],
            "pressure_level": ["500", "1000"],
            "year": d.date().year,
            "month": d.date().month,
            "day": d.date().day,
            "time": d.time().hour,
            "area": area,
        },
        filename_pl,
    )

    g1 = mv.read(filename_sfc)
    g2 = mv.read(filename_pl)
    mv.write(filename, mv.merge(g1, g2))
    g = mv.read(filename)
else:
    if mv.exist(filename):
        g = mv.read(filename)
    else:
        g = mv.gallery.load_dataset(filename)

# get mean sea level pressure
msl = mv.read(data=g, param="msl")

p_top = 500
p_bottom = 1000

# compute thickness
z1 = mv.read(data=g, param="z", levelist=p_top)
z2 = mv.read(data=g, param="z", levelist=p_bottom)
th = z1 - z2

# compute thermal wind
tw = mv.geostrophic_wind(th)

# define controur and wind style
cont_th = mv.mcont(
    legend="on",
    contour_line_style="dash",
    contour_line_thickness=1,
    contour_line_colour="brick",
    contour_highlight="off",
    contour_label="off",
    contour_label_height=0.4,
    contour_level_selection_type="interval",
    contour_interval=4,
    contour_max_level=576,
    contour_min_level=528,
    contour_shade="on",
    contour_shade_method="area_fill",
    contour_shade_max_level_colour="RGB(0.952,0.4205,0.4205)",
    contour_shade_min_level_colour="RGB(0.7333,0.5334,0.8862)",
    contour_shade_colour_direction="clockwise",
)

cont_msl = mv.mcont(
    contour_line_thickness=3,
    contour_line_style="dash",
    contour_line_colour="charcoal",
    contour_highlight="off",
    contour_level_selection_type="interval",
    contour_interval=5,
)

w_style = mv.mwind(
    wind_thinning_factor=6,
    legend="on",
    wind_arrow_colour="navy",
    wind_arrow_unit_velocity=30,
    wind_arrow_head_shape=1,
    wind_arrow_head_ratio=0.3,
)

# define title
vdate = mv.valid_date(th)
title = mv.mtext(
    text_lines="msl and {}/{} hPa thickness [dam] and thermal wind {}".format(
        p_top, p_bottom, vdate.strftime("%Y-%m-%d %H UTC")
    ),
    text_font_size=0.5,
)

# define view
coastlines = mv.mcoast(map_coastline_thickness=2)

view = mv.geoview(
    map_projection="polar_stereographic",
    map_area_definition="corners",
    area=[26.63, -172, 55.05, -117.1],
    map_vertical_longitude=-150,
    coastlines=coastlines,
)

# define legend
legend = mv.mlegend(legend_text_font_size=0.4)

# define output
mv.setoutput(mv.pdf_output(output_name="thermal_wind"))

# generate plot - scale thickness to dam units
mv.plot(view, th / (9.81 * 10), cont_th, msl, cont_msl, tw, w_style, title, legend)