Note
Click here to download the full example code
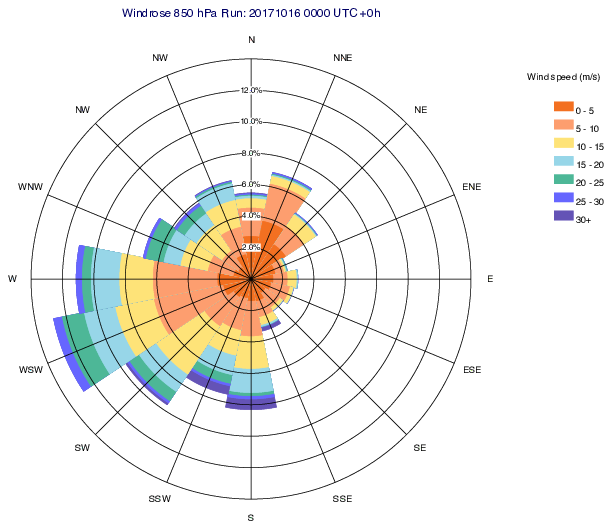
GRIB - Windrose
# (C) Copyright 2017- ECMWF.
#
# This software is licensed under the terms of the Apache Licence Version 2.0
# which can be obtained at http://www.apache.org/licenses/LICENSE-2.0.
#
# In applying this licence, ECMWF does not waive the privileges and immunities
# granted to it by virtue of its status as an intergovernmental organisation
# nor does it submit to any jurisdiction.
#

import numpy as np
import metview as mv


class WindRoseData:
    """Generate windrose data"""

    def __init__(
        self, sp=None, direction=None, sectors=16, speed_bins=[], percent=True
    ):
        if len(speed_bins) < 2:
            raise ValueError(f"speed_bins must have at least 2 elements!")

        self.sectors = sectors
        self.dir_step = 360.0 / sectors
        self.dir_bins = np.linspace(
            int(-self.dir_step / 2),
            int(360 + self.dir_step / 2),
            int(360 / self.dir_step) + 2,
        )
        self.speed_max = 0
        self.speed_bins = speed_bins
        self.max_val = 0
        self.percent = percent
        self.res = None
        self._compute(sp, direction)

    def _compute(self, speed, direction):
        # remove missing values
        mask = ~np.isnan(speed)
        if np.any(mask):
            speed = speed[mask]
            direction = direction[mask]

        num = len(speed)
        self.speed_max = np.max(speed)
        if num > 2 and len(speed) == len(direction):
            self.res = np.histogram2d(
                speed, direction, bins=[self.speed_bins, self.dir_bins], normed=False
            )[0]

            # unify the north bins
            self.res[:, 0] = self.res[:, 0] + self.res[:, -1]
            self.res = self.res[:, :-1]
            self.dir_bins = self.dir_bins[:-1]

            if self.percent:
                self.res *= 100.0 / self.res.sum()

            self.max_val = np.max(self.res.sum(axis=0))


def build_sectors(
    data,
    sector_gap=0,
    fill_colours=None,
    outline_colours=None,
    x_scale=1.0,
    y_scale=1.0,
):
    """
    Define the windrose sector graphical objects.

    If outline_colours is None it will have the same values as fill_colours
    """

    gr_lst = []

    def _init_colours(cols, default_val):
        if cols is None:
            cols = "red"

        if isinstance(cols, str):
            cols = [cols] * (len(data.speed_bins) - 1)
        elif isinstance(cols, list):
            if len(cols) == 0:
                cols = ["red"] * (len(data.speed_bins) - 1)
            elif len(cols) < len(data.speed_bins) - 1:
                cols = list(cols)
                for i in range(len(cols), len(data.speed_bins)):
                    cols.append(cols[-1])
        return cols

    # init colours
    fill_colours = _init_colours(fill_colours, "red")
    if outline_colours is None:
        outline_colours = fill_colours
    else:
        outline_colours = _init_colours(outline_colours, "red")

    # sector gap in degrees
    if sector_gap < 0.5:
        sector_gap = 0
    elif sector_gap > data.dir_step - 2:
        raise ValueError(
            f"sector_gap={sector_gap} is too large! Maximum value={data.dir_step-2}"
        )

    x_cent = 0
    y_cent = 0
    d_angle = 0.5
    for i in range(len(data.dir_bins) - 1):
        start_angle = 90 - data.dir_bins[i]
        end_angle = 90 - data.dir_bins[i + 1]
        if start_angle > end_angle:
            start_angle, end_angle = end_angle, start_angle

        start_angle += sector_gap / 2.0
        end_angle -= sector_gap / 2.0
        for j in range(len(data.speed_bins) - 2, -1, -1):
            radius = data.res[0 : j + 1, i].sum()
            pie_x = [x_cent]
            pie_y = [y_cent]
            angle = start_angle
            while angle <= end_angle:
                pie_x.append(x_scale * radius * np.cos(np.radians(angle)) - x_cent)
                pie_y.append(y_scale * radius * np.sin(np.radians(angle)) - y_cent)
                angle += d_angle
            pie_x.append(x_scale * radius * np.cos(np.radians(end_angle)) - x_cent)
            pie_y.append(y_scale * radius * np.sin(np.radians(end_angle)) - y_cent)
            pie_x.append(x_cent)
            pie_y.append(y_cent)

            vis = mv.input_visualiser(input_x_values=pie_x, input_y_values=pie_y)
            legend = "on" if i == 1 else "off"
            graph = mv.mgraph(
                legend=legend,
                graph_type="area",
                graph_line_colour=outline_colours[j],
                graph_shade_colour=fill_colours[j],
            )
            gr_lst.extend([vis, graph])
    return gr_lst


def build_view(
    incr=2,
    max_val=20,
    val_label_size=0.35,
    dir_label_size=0.4,
    colour="black",
    percent=True,
):
    """Define the windrose background"""

    add_val_labels = True
    add_dir_labels = True

    # horizontal and vertical axes has to be hidden
    h_axis = mv.maxis(
        axis_position="left",
        axis_line="off",
        axis_grid="off",
        axis_title="off",
        axis_tick="off",
        axis_tick_label="off",
    )
    v_axis = mv.maxis(
        axis_position="bottom",
        axis_line="off",
        axis_grid="off",
        axis_title="off",
        axis_tick="off",
        axis_tick_label="off",
    )

    max_val = np.ceil(max_val / incr) * incr

    # the view is larger than the max val size because we need space for the
    # direction labels

    # distance of the dir labels from the outmost circle
    dir_label_distance = 1.2

    # estimated radial size of a dir label
    dir_label_space = 1

    # the maximum radial size of the coordinate system
    view_max_val = max_val + dir_label_distance + dir_label_space

    # NOTE: In order to correctly render the windrose chart (we want
    # concentric circles instead of ellipses) we have to
    # apply a scaling to compensate the difference between the physical
    # width and height of the plot. Please note that while the page size is defined
    # in % the superpage size is defined in cm! See also subpage size in the view.

    # we define A4 landscape
    sp_width = 29.7
    sp_height = 21
    page_top = 0
    page_left = 0
    page_width = 80
    page_height = 100
    x_scale = (sp_height / sp_width) * (page_height / page_width)
    y_scale = 1.0

    # the view
    view = mv.cartesianview(
        x_automatic="off",
        x_min=-view_max_val,
        x_max=view_max_val,
        y_automatic="off",
        y_min=-view_max_val,
        y_max=view_max_val,
        horizontal_axis=h_axis,
        vertical_axis=h_axis,
        subpage_frame="off",
        subpage_x_position=5,
        subpage_y_position=5,
        subpage_x_length=90,
        subpage_y_length=90,
    )

    # size is in % of the physical size of the superpage!
    page = mv.plot_page(
        top=page_top,
        bottom=page_top + page_height,
        left=page_left,
        right=page_left + page_width,
        view=view,
    )

    # size is in cm!
    dw = mv.plot_superpage(
        layout_size="custom", custom_width=sp_width, custom_height=sp_height, pages=page
    )

    gr_lst = []

    # build the concentric circles
    sp = incr
    angle_incr = 2 * np.pi / 180.0
    while sp <= max_val:
        xp = x_scale * sp * np.cos(np.array([i * angle_incr for i in range(1, 182)]))
        yp = sp * np.sin(np.array([i * angle_incr for i in range(1, 182)]))
        gr = mv.xy_curve(xp, yp, colour, "solid", 1)
        gr_lst.append(gr)
        sp += incr

    # build direction lines
    for angle in np.arange(0, 180, 22.5):
        angle_1 = np.radians(angle)
        angle_2 = np.radians(angle + 180)
        gr_lst.append(
            mv.xy_curve(
                np.array([np.cos(angle_1), np.cos(angle_2)]) * max_val * x_scale,
                np.array([np.sin(angle_1), np.sin(angle_2)]) * max_val,
                colour,
                "solid",
                1,
            )
        )

    # build direction labels
    if add_dir_labels:
        dir_labels = {
            "N": 0,
            "NNE": 22.5,
            "NE": 45,
            "ENE": 67.5,
            "E": 90,
            "ESE": 112.5,
            "SE": 135,
            "SSE": 157.5,
            "S": 180,
            "SSW": 202.5,
            "SW": 225,
            "WSW": 247.5,
            "W": 270,
            "WNW": 292.5,
            "NW": 315,
            "NNW": 337.5,
        }

        r_label = max_val + dir_label_distance
        angle_label = 90 - np.array(list(dir_labels.values()))
        idx_label = list(range(len(dir_labels)))
        vis = mv.input_visualiser(
            input_plot_type="xy_point",
            input_x_values=x_scale * r_label * np.cos(np.radians(angle_label)),
            input_y_values=r_label * np.sin(np.radians(angle_label)),
            input_values=idx_label,
        )

        sym = mv.msymb(
            legend="off",
            symbol_type="text",
            symbol_table_mode="advanced",
            symbol_advanced_table_selection_type="list",
            symbol_advanced_table_level_list=[*idx_label, idx_label[-1] + 1],
            symbol_advanced_table_height_list=0.001,
            symbol_advanced_table_text_list=list(dir_labels.keys()),
            symbol_advanced_table_text_font_size=dir_label_size,
            symbol_advanced_table_text_font_style="normal",
            symbol_advanced_table_text_font_colour="black",
            symbol_advanced_table_text_display_type="centre",
        )

        gr_lst.extend([vis, sym])

    # build value labels
    if add_val_labels:
        val_label = [str(i) for i in np.arange(incr, max_val, incr)]
        if percent:
            val_label = [f"{i}%" for i in val_label]

        angle = np.radians(90)
        idx_label = list(range(len(val_label)))
        vis = mv.input_visualiser(
            input_plot_type="xy_point",
            input_x_values=np.cos(angle)
            * np.array([sp for sp in np.arange(incr, max_val, incr)]),
            input_y_values=np.sin(angle)
            * np.array([sp for sp in np.arange(incr, max_val, incr)]),
            input_values=idx_label,
        )

        idx_label_level = list(idx_label)
        idx_label_level.append(idx_label_level[-1] + 1)
        sym = mv.msymb(
            legend="off",
            symbol_type="text",
            symbol_text_blanking="on",
            symbol_table_mode="advanced",
            symbol_advanced_table_selection_type="list",
            symbol_advanced_table_level_list=idx_label_level,
            symbol_advanced_table_height_list=0.001,
            symbol_advanced_table_text_list=val_label,
            symbol_advanced_table_text_font_size=val_label_size,
            symbol_advanced_table_text_font_style="normal",
            symbol_advanced_table_text_font_colour="black",
            symbol_advanced_table_text_display_type="centre",
        )

        gr_lst.extend([vis, sym])

    return dw, gr_lst, x_scale, y_scale


# get data
use_mars = False
if use_mars:
    # get data from MARS
    f = mv.retrieve(
        levelist=850,
        param=["u", "v"],
        date=20171016,
        time=0,
        area=[30, -40, 60, 30],
        grid=[0.5, 0.5],
    )
else:
    # read from grib file
    filename = "ophelia_wind_850.grib"
    if mv.exist(filename):
        f = mv.read(filename)
    else:
        f = mv.gallery.load_dataset(filename)


# get u and v data
u = mv.read(data=f, param="u")
v = mv.read(data=f, param="v")

# compute speed and direction
sp = mv.speed(u, v).values()
direct = mv.direction(u, v).values()

# define speed bins and colours
speed_bins = np.array([0, 5, 10, 15, 20, 25, 30, 100])
speed_colours = [
    "RGB(0.9529,0.4392,0.1294)",
    "RGB(0.9922,0.6196,0.4353)",
    "RGB(0.9961,0.8902,0.4706)",
    "RGB(0.5922,0.8392,0.9098)",
    "RGB(0.3020,0.7176,0.5922)",
    "RGB(0.4000,0.4000,1.0000)",
    "RGB(0.3922,0.3255,0.7137)",
]

# generate windrose data
wr = WindRoseData(sp, direct, speed_bins=speed_bins, percent=True)

# generate windrose view
dw, gr_lst, x_scale, y_scale = build_view(incr=2, max_val=wr.max_val, colour="black")

# generate windrose sector objects
gr_wind = build_sectors(
    wr,
    sector_gap=0,
    fill_colours=speed_colours,
    outline_colours=None,
    x_scale=x_scale,
    y_scale=y_scale,
)

# define legend with custom labels. Here we have to follow the order the sectors
# were built, i.e. we need to go from high wind speeds to low wind speeds
legend_text = [
    f"{speed_bins[i]} - {speed_bins[i + 1]}" for i in range(len(speed_bins) - 2, -1, -1)
]
legend_text[0] = f"{speed_bins[-2]}+"

legend = mv.mlegend(
    legend_title="on",
    legend_title_text="Wind speed (m/s)",
    legend_title_font_size=0.4,
    legend_title_position="top",
    legend_text_colour="black",
    legend_box_mode="positional",
    legend_display_type="disjoint",
    legend_text_composition="user_text_only",
    legend_user_lines=legend_text,
    legend_text_font_size=0.4,
    legend_entry_plot_direction="column",
    legend_box_x_position=23,
    legend_box_y_position=12,
    legend_box_x_length=1,
    legend_box_y_length=7,
    legend_entry_text_width=2,
)


# get metadata for the title
meta = mv.grib_get(u[0], ["level", "date", "time", "step"])[0]

# define title
title = mv.mtext(
    text_lines=f"Windrose {meta[0]} hPa Run: {meta[1]} {meta[2]} UTC +{meta[3]}h",
    text_font_size=0.5,
)

# define the output plot file
mv.setoutput(mv.pdf_output(output_name="windrose"))

# generate the plot
mv.plot(dw, gr_wind, gr_lst, legend, title)