Part 3 - BUFR
Setup
Navigate into the 3_bufr folder within Metview.
Examine the BUFR file
Right-click and examine the supplied BUFR file obs.bufr, bringing up the BUFR Examiner tool.
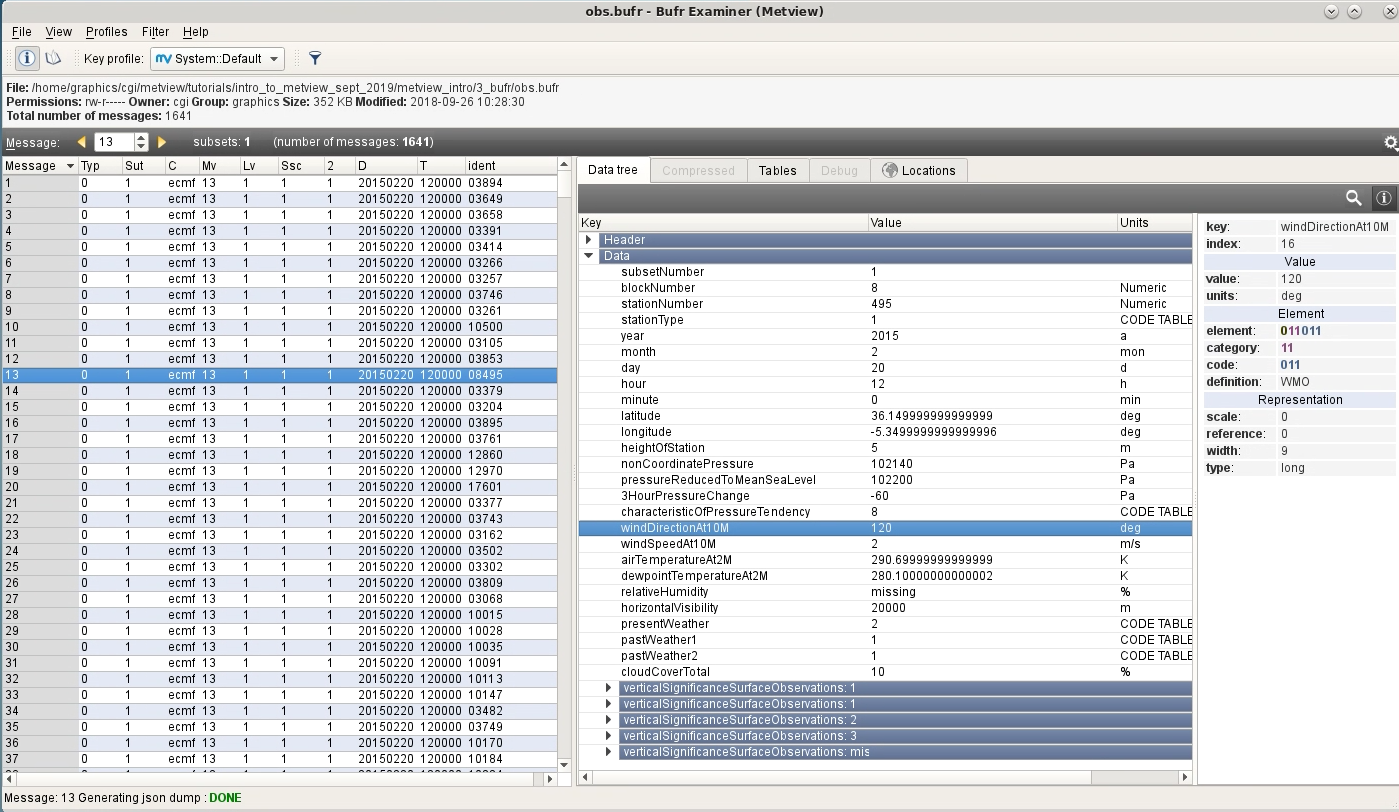

Have a look around to see what’s in the file, then find the key airTemperatureAt2M in the Data Tree tab. Right-click and Copy item to get this key name into the clipboard.
Filtering the BUFR file
We will now extract the 2m temperature values from the file. Create a new Observation Filter icon and edit it, setting the following parameters:
Parameter |
Value |
Notes |
Data |
obs.bufr |
Drop the obs.bufr icon into the editor box |
Output |
Geopoints |
|
Parameter |
airTemperatureAt2M |
Can put ecCodes key names or numeric descriptors here |
The editor should look like this:
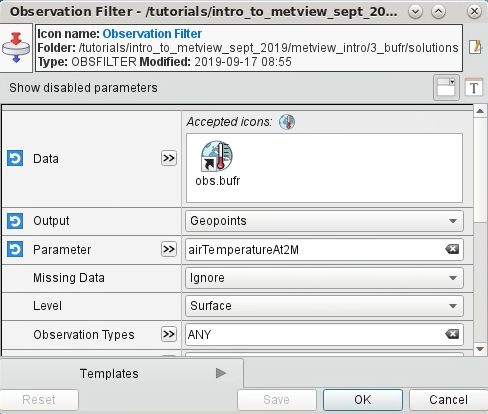
Click OK, then examine the Obervation Filter icon.
The filtering step will be executed automatically and the resulting Geopoints data will appear in the examiner.
You could also right-click on the icon and save the data, or drop the icon into a Python script file and add a write() command to write it to disk.
There are various possible output formats, but the standard geopoints output is a text file that looks like this:

Now visualise the result of the Observation Filter and drop the supplied icons symbol_plotting and coast_dark into the plot window.

Scriptify it
Filter, write and plot
Create a new Python Script icon, edit it and drop the Observation Filter (and rename the variable to t2m; also, absolute paths can be shortened to relative paths), coast_dark and symbol_plotting icons into the editor.
Add the following commands to the end of the script and run it:
mv.plot(coast_dark, t2m, symbol_plotting)
mv.write('obs_t2m.gpt', t2m)
Extract values and compute statistics
Create a copy of the script, remove the plotting commands and add the following lines. The first two return numpy arrays, the third line returns a pandas dataframe.
print(mv.latitudes(t2m))
print(mv.values(t2m))
df = t2m.to_dataframe()
print(df)
print(df.describe())
If you have extra time…
Have a look in the solutions folder - there is a script called field_values_at_gpts_locations.py. This does several things, including using geopoints as a set of locations to extract values from a GRIB field, computing the differences between geopoints and GRIB fields, and plotting the differences to a PDF file.