Note
Click here to download the full example code
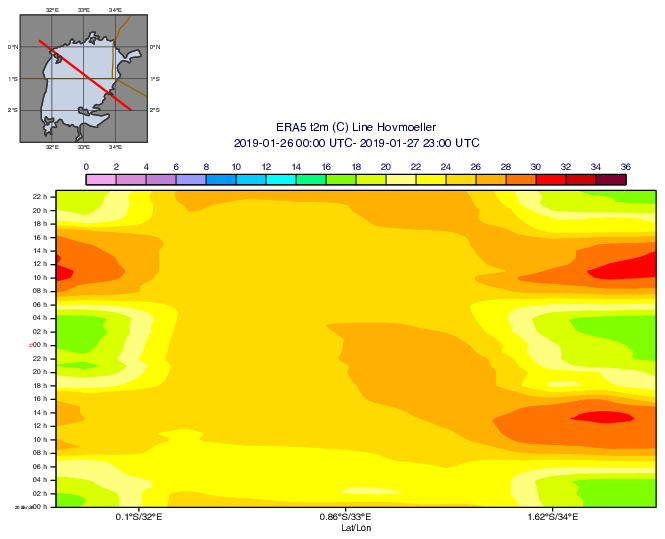
GRIB - Line Hovmoeller with Map T2 from ERA5
# (C) Copyright 2017- ECMWF.
#
# This software is licensed under the terms of the Apache Licence Version 2.0
# which can be obtained at http://www.apache.org/licenses/LICENSE-2.0.
#
# In applying this licence, ECMWF does not waive the privileges and immunities
# granted to it by virtue of its status as an intergovernmental organisation
# nor does it submit to any jurisdiction.
#

import metview as mv

# getting data
use_cds = False

filename = "t2_era5_lake_victoria.grib"

# getting forecast data from CDS
if use_cds:
    import cdsapi

    c = cdsapi.Client()

    c.retrieve(
        "reanalysis-era5-single-levels",
        {
            "product_type": "reanalysis",
            "format": "grib",
            "variable": "2m_temperature",
            "year": "2019",
            "month": "01",
            "day": ["26", "27"],
            "time": list(range(0, 24)),
            "area": [5, -30, -5, 40],
        },
        filename,
    )
    g = mv.read(filename)
# getting data locally or from file server
else:
    if mv.exist(filename):
        g = mv.read(filename)
    else:
        g = mv.gallery.load_dataset(filename)

# extract fields
t = g.select(shortName="2t")

# scale t2m to Celsius
t = t - 273.16

# define section line over Lake Victoria (N,W,S,E)
line = [0.2, 31.6, -2, 34.5]

# ---------------------------------------------
#  Define line Hovmoeller
# ---------------------------------------------

# define time axis
time_axis = mv.maxis(
    axis_type="date",
    axis_date_type="hours",
    axis_days_label="number",
    axis_hours_label="on",
    axis_hours_label_quality="high",
    axis_hours_label_height=0.3,
)

# define geo axis
geo_axis = mv.maxis(
    axis_tick_label_height=0.4, axis_title_text="Lat/Lon", axis_title_height=0.4
)
# define line Hovmoeller view
hov_view = mv.mhovmoellerview(
    type="line_hovm",
    line=line,
    resolution=0.25,
    swap_axis="no",
    time_axis=time_axis,
    geo_axis=geo_axis,
)

# define t2m contouring
t_cont = mv.mcont(
    legend="on",
    contour="off",
    contour_level_selection_type="interval",
    contour_max_level=36,
    contour_min_level=0,
    contour_interval=2,
    contour_label="off",
    contour_shade="on",
    contour_shade_colour_method="palette",
    contour_shade_method="area_fill",
    contour_shade_palette_name="eccharts_rainbow_purple_burgundy_18",
)

# define legend
legend = mv.mlegend(legend_text_font_size=0.4)

# define title
start_dt = mv.base_date(t[0])
end_dt = mv.base_date(t[-1])

title = mv.mtext(
    text_lines=[
        f"ERA5 t2m (C) Line Hovmoeller",
        "{} UTC- {} UTC".format(
            start_dt.strftime("%Y-%m-%d %H:%M"), end_dt.strftime("%Y-%m-%d %H:%M")
        ),
        "",
    ],
    text_font_size=0.5,
)

# ---------------------------------------------
#  Define map view
# ---------------------------------------------

# define coastlines
coast = mv.mcoast(
    map_coastline_colour="charcoal",
    map_coastline_resolution="medium",
    map_coastline_thickness=2,
    map_coastline_land_shade="on",
    map_coastline_land_shade_colour="RGB(0.5333,0.5333,0.5333)",
    map_coastline_sea_shade="on",
    map_coastline_sea_shade_colour="RGB(0.7765,0.8177,0.8941)",
    map_boundaries="on",
    map_boundaries_colour="mustard",
    map_boundaries_thickness=2,
    map_grid_colour="RGB(0.2627,0.2627,0.2627)",
    map_grid_latitude_increment=1,
    map_grid_longitude_increment=1,
)

# define map view
g_view = mv.geoview(
    map_area_definition="corners",
    area=[1, 31, -3, 35],
    coastlines=coast,
    subpage_y_lenght=75,
)

# cross section line visualiser
vis_line = mv.input_visualiser(
    input_plot_type="geo_points",
    input_longitude_values=[line[1], line[3]],
    input_latitude_values=[line[0], line[2]],
)

graph_line = mv.mgraph(graph_line_colour="red", graph_line_thickness=4)

# ---------------------------------------------
#  Define layout
# --------------------------------------------

map_page = mv.plot_page(bottom=30, view=g_view)
hov_page = mv.plot_page(top=30, view=hov_view)
dw = mv.plot_superpage(pages=[map_page, hov_page])

# define the output plot file
mv.setoutput(mv.pdf_output(output_name="line_hovm_with_map_era5"))

# generate plot
mv.plot(dw[0], vis_line, graph_line, dw[1], t, t_cont, legend, title)