Note
Click here to download the full example code
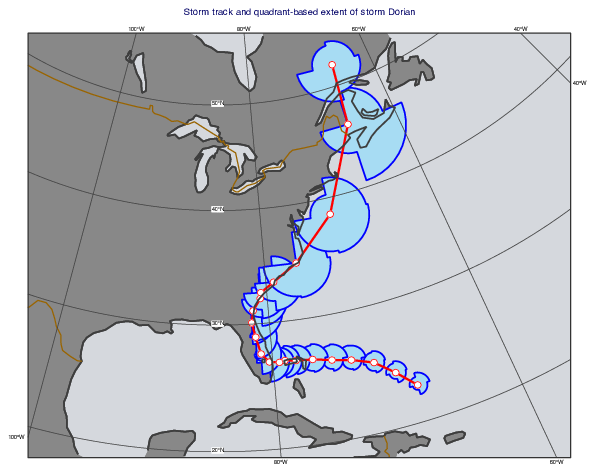
CSV - Storm Wind Quadrants
# (C) Copyright 2017- ECMWF.
#
# This software is licensed under the terms of the Apache Licence Version 2.0
# which can be obtained at http://www.apache.org/licenses/LICENSE-2.0.
#
# In applying this licence, ECMWF does not waive the privileges and immunities
# granted to it by virtue of its status as an intergovernmental organisation
# nor does it submit to any jurisdiction.
#

import metview as mv

# read CSV file with the track positions and quadrant sizes in (km)
filename = "dorian_track.csv"
if not mv.exist(filename):
    mv.gallery.load_dataset(filename)

tbl = mv.read_table(
    table_delimiter=" ",
    table_combine_delimiters="on",
    table_header_row=0,
    table_filename="dorian_track.csv",
)

# read track and quadrant details into a set of vectors
lon = mv.values(tbl, 1)
lat = mv.values(tbl, 0)
quad1 = mv.values(tbl, 2)
quad2 = mv.values(tbl, 3)
quad3 = mv.values(tbl, 4)
quad4 = mv.values(tbl, 5)

# build input visualiser objects to represent storm quadrants
quad_vis = []
for i in range(len(lon)):
    radiusLst = [quad1[i], quad2[i], quad3[i], quad4[i]]
    quad_vis.append(mv.mvl_geocircle(lat[i], lon[i], radiusLst, 40))

# create visual definition for storm quadrants
quad_graph = mv.mgraph(
    graph_type="area",
    graph_shade_colour="RGB(0.6532,0.8642,0.9546)",
    graph_line_colour="blue",
    graph_line_thickness="3",
    graph_line_style="solid",
)

# create visualiser for the track
track_vis = mv.input_visualiser(
    input_plot_type="geo_points",
    input_longitude_values=list(lon),
    input_latitude_values=list(lat),
)

# create visual definition for the track
track_graph = mv.mgraph(
    graph_line_colour="red",
    graph_line_thickness=4,
    graph_symbol="on",
    graph_symbol_colour="white",
    graph_symbol_height=0.5,
    graph_symbol_marker_index=15,
    graph_symbol_outline="on",
    graph_symbol_outline_colour="red",
)

# define coastlines
coast = mv.mcoast(
    map_coastline_colour="RGB(0.2449,0.2414,0.2414)",
    map_coastline_thickness=3,
    map_coastline_resolution="low",
    map_coastline_land_shade="on",
    map_coastline_land_shade_colour="RGB(0.5333,0.5333,0.5333)",
    map_coastline_sea_shade="on",
    map_coastline_sea_shade_colour="RGB(0.8358,0.8469,0.8662)",
    map_boundaries="on",
    map_boundaries_colour="mustard",
    map_boundaries_thickness=2,
    map_grid_colour="RGB(0.2627,0.2627,0.2627)",
)

# define geographical view
view = mv.geoview(
    map_projection="polar_stereographic",
    map_area_definition="corners",
    area=[17.78, -99.6, 41.38, -35.65],
    map_vertical_longitude=-85,
    coastlines=coast,
)

# define tile
title = mv.mtext(
    text_lines=["Storm track and quadrant-based extent of storm Dorian"],
    text_font_size=0.4,
)

# define the output plot file
mv.setoutput(mv.pdf_output(output_name="storm_quadrants"))

mv.plot(view, quad_vis, quad_graph, track_vis, track_graph, title)