Layer Management in the Display Window
Layers
The Layers tab in the sidebar of the Display Window allows for some sophisticated interactive editing of the current plot.
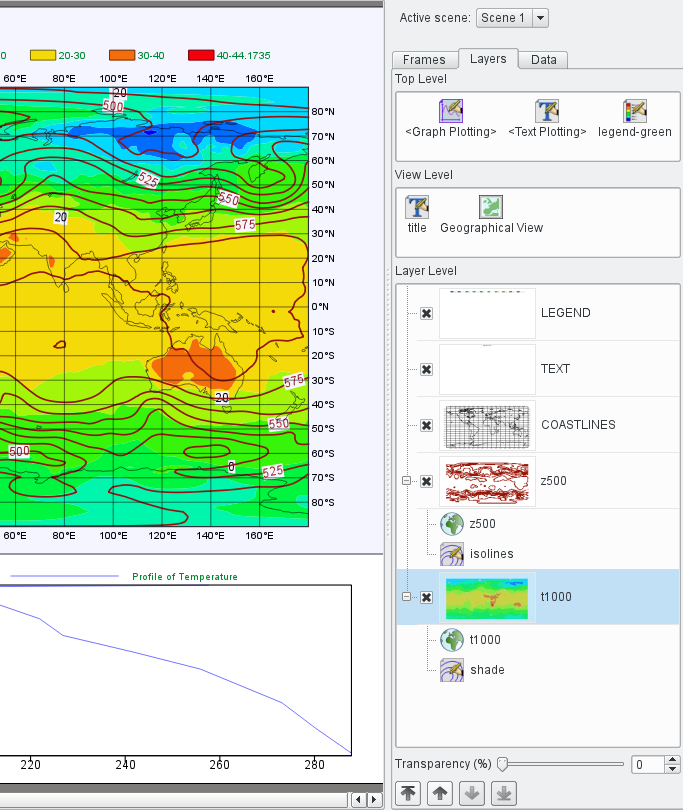
Remember that the Display Window shows a layout containing one or more views, each view containing a number of data layers. The image on the right shows a Metview Display Window with two views (one Geographic and one Vertical Profile). The Geographic View is selected and contains two data fields, each with its own Contouring icon, plus a custom Text Plotting icon for the title. The Layers tab of the sidebar is open; this page describes how to use its layer management features.
Description of the Levels
The Layers tab is divided into three sections, forming a hierarchy as described below. Understanding this organisation allows for more sophisticated plot editing. The Display Window also refers to a view as a scene. See Analysis Views and Layout in Metview for more information.
Layer Level
This is where the actual graphical layers are shown for the currently-selected view. They can be re-ordered, removed, their transparency set and their visdefs edited.
View Level
This section shows the icons that are applied to the currently-selected view and are not specific to any particular data layer. Any data layer which does not have a visdef attached directly to it in the Layer Level will take its visdef from here if there is a suitable one. It also holds the Legend and Text Plotting icons for the view.
Top Level
This section shows the icons that are applied to all the views and are not specific to any particular view or data layer. Any data layer which does not have a visdef attached directly to it in the Layer Level and does not find one in the View Level will take its visdef from here if there is a suitable one. It also holds the Legend and Text Plotting icons that will be used by any views which do not have their own.
Using the Layer Management
Changing the layer order and transparency
The Layer Level section contains all the graphical layers of the plot - they can be re-ordered by dragging each layer up or down, or by clicking on the up and down arrows at the bottom. Their transparency level can also be set using the slider at the bottom.
Changing the visdefs applied to a particular data item
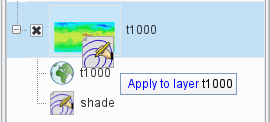
Normally, when a data visdef icon is dropped into a Display Window, it is applied to all data layers for which it is valid. If you want to apply a visdef to just one data layer, you can drop it onto that specific layer in the Layer Level section. A tip will appear to confirm which layer it will be applied to. Single or multiple visdef icons can be applied in this way, and will replace any visdefs currently applied to that data.
Visdef icons currently applied to a data layer can also be edited directly from here - double-click on the visdef icon, or right-click | Edit in plot, modify the parameters and click Ok . The changes are applied immediately to the plot. Your changes will not be saved back to the original visdef icon until you choose Save to disk from the context menu for that visdef. From the context menu you can also remove the visdef from its data layer.
Changing the visdefs applied to multiple data items in a view
Any visdef icons present in the View Level will be applied to any suitable layers which do not have a visdef directly attached to them. Therefore, first ensure that any data items you want to affect in unison do not have their own visdefs at the Layer Level. Then drop and edit visdef icons in the View Level to affect these items in one go. Icon names with <angular brackets> around them denote the system default visdef; these can be edited, but cannot be saved to disk. If the Display Window contains multiple views, check the current selection with the Active Scene control at the top.
Changing the visdefs applied to all views in the window (e.g. stamp plots)
Any visdef icons in the Top Level will be applied to any suitable data items which a) don’t have their own visdef attached directly to them, and b) do not inherit any visdefs from their View Level. So if a number of views have been plotted without any visdefs attached to their data, dropping a suitable visdef icon into the Top Level will cause it to be applied to the data in all these views. Icon names with <angular brackets> around them denote the system default visdef; these can be edited, but cannot be saved to disk.
Changing titles and legends
These icons can be dropped into either the View Level (to apply to the current view) or the Top Level (to apply to all views which do not have their own such icons). They can also be edited directly from both places.