Note
Click here to download the full example code
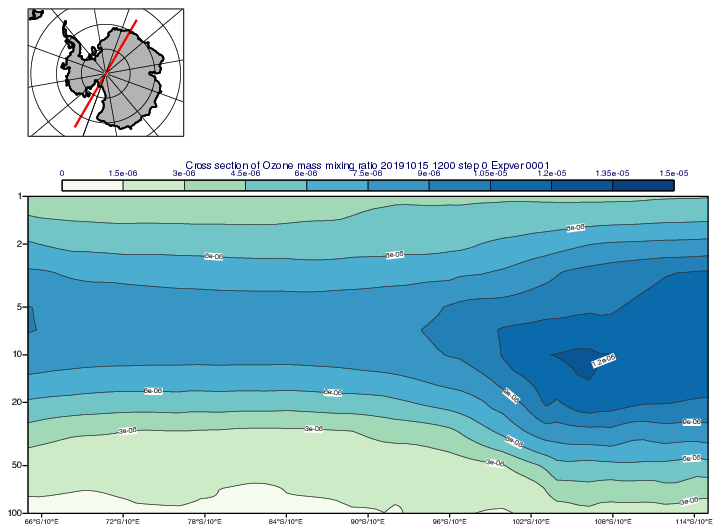
Cross Section Going Through the South Pole
# (C) Copyright 2017- ECMWF.
#
# This software is licensed under the terms of the Apache Licence Version 2.0
# which can be obtained at http://www.apache.org/licenses/LICENSE-2.0.
#
# In applying this licence, ECMWF does not waive the privileges and immunities
# granted to it by virtue of its status as an intergovernmental organisation
# nor does it submit to any jurisdiction.
#

import metview as mv

# get input (pressure level) data
use_mars = False

# retrieve analysis data from MARS
if use_mars:
    f_o3 = mv.retrieve(
        levelist=[
            1000,
            850,
            700,
            500,
            400,
            300,
            250,
            200,
            150,
            100,
            70,
            50,
            30,
            20,
            10,
            7,
            5,
            3,
            2,
            1,
        ],
        param="o3",
        date=20191015,
        time=12,
        area=[-65, -180, -90, 180],
        grid=[1, 1],
    )
# read data from file
else:
    filename = "ozone_pl.grib"
    if mv.exist(filename):
        f_o3 = mv.read(filename)
    else:
        f_o3 = mv.gallery.load_dataset(filename)

# ---------------------------
# Cross section
# ----------------------------

# define cross section line via the South Pole going
# from [65S, 10E] to [65S, 170W].
line = [-65, 10, -115, 10]

# define vertical axis
vertical_axis = mv.maxis(axis_tick_label_height=0.4)

# define cross section view wind projected to the normal vector of the
# cross section plane
xs = mv.mxsectview(
    bottom_level=100,
    top_level=1,
    line=line,
    wind_parallel="off",
    wind_perpendicular="on",
    wind_intenisty="off",
    vertical_scaling="log",
    vertical_axiix=vertical_axis,
)

# define contour shading for ozone
o3_shade = mv.mcont(
    legend="on",
    contour_line_colour="charcoal",
    contour_highlight="off",
    contour_max_level=1.5e-5,
    contour_min_level=0,
    contour_shade="on",
    contour_shade_colour_method="palette",
    contour_shade_method="area_fill",
    contour_shade_palette_name="m_blue_green2_10",
    grib_scaling_of_retrieved_fields="off",
)

# ---------------------------------------------
#  Map view with cross section line
# ---------------------------------------------

# define coastlines
coast = mv.mcoast(
    map_coastline_thickness=3,
    map_grid_longitude_increment=30,
    map_label="off",
    map_coastline_land_shade="on",
    map_coastline_land_shade_colour="grey",
)

# define map view
map = mv.geoview(
    map_projection="polar_stereographic",
    map_area_definition="corners",
    area=[-50.67, -148.88, -50.2, 30.29],
    map_hemisphere="south",
    map_vertical_longitude=160,
    coastlines=coast,
    subpage_y_lenght=75,
)

# cross section line visualiser
vis_line = mv.input_visualiser(
    input_plot_type="geo_points",
    input_longitude_values=[line[1], line[3]],
    input_latitude_values=[line[0], line[2]],
)

graph_line = mv.mgraph(graph_line_colour="red", graph_line_thickness=4)

# ---------------------------------------------
#  Define layout
# --------------------------------------------

map_page = mv.plot_page(bottom=30, view=map)

xs_page = mv.plot_page(top=30, view=xs)

dw = mv.plot_superpage(pages=[map_page, xs_page])

# ---------------------------------------------
#  Generate plot
# --------------------------------------------

# xs legend
xs_legend = mv.mlegend(legend_text_font_size="0.35")

# xs title
xs_title = mv.mtext(text_font_size="0.45")

# define the output plot file
mv.setoutput(mv.pdf_output(output_name="cross_section_via_pole"))

# generate plot
mv.plot(dw[0], vis_line, graph_line, dw[1], f_o3, o3_shade, xs_legend, xs_title)