Note
Click here to download the full example code
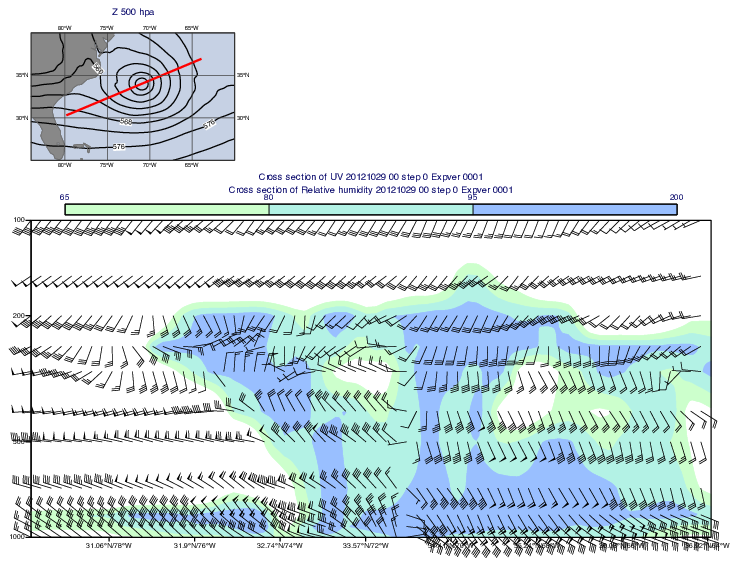
Cross Section Unprojected Wind and Relative Humidity with Map
# (C) Copyright 2017- ECMWF.
#
# This software is licensed under the terms of the Apache Licence Version 2.0
# which can be obtained at http://www.apache.org/licenses/LICENSE-2.0.
#
# In applying this licence, ECMWF does not waive the privileges and immunities
# granted to it by virtue of its status as an intergovernmental organisation
# nor does it submit to any jurisdiction.
#

import metview as mv

# get data - superstorm Sandy
use_mars = False

# get data from MARS
if use_mars:
    g = mv.retrieve(
        type="fc",
        levelist=[1000, 925, 850, 700, 500, 400, 300, 250, 200, 150, 100],
        param=["r", "z", "u", "v"],
        date=20121029,
        time=0,
        step=0,
        area=[40, -84, 25, -60],
        grid=[0.25, 0.25],
    )
# read data from GRIB file
else:
    filename = "sandy_pl_025.grib"
    if mv.exist(filename):
        g = mv.read(filename)
    else:
        g = mv.gallery.load_dataset(filename)

# read pressure level data
f_uv = mv.read(data=g, param=["u", "v"])
f_r = mv.read(data=g, param="r")
f_z = mv.read(data=g, param="z", levelist=500)

# ---------------------------
# Cross section
# ----------------------------

# define cross section line
line = [30.30, -79.83, 36.95, -63.92]

# define cross section view with wind along the cross section plane
xs = mv.mxsectview(
    bottom_level=1000,
    top_level=100,
    line=line,
    wind_parallel="off",
    wind_perpendicular="off",
    wind_intenisty="off",
    wind_unprojected="on",
    vertical_scaling="log",
)

# define relative humidity contour shading
r_shade = mv.mcont(
    contour_automatic_setting="style_name",
    contour_style_name="sh_grnblu_f65t100i15_light",
    legend="on",
)

# define wind plotting style
wind_style = mv.mwind(
    wind_field_type="flags",
    wind_thinning_factor=1,
    wind_flag_colour="black",
    wind_flag_origin_marker="off",
    wind_flag_length=0.7,
)

# cross section title
xs_title = mv.mtext(text_font_size=0.4)

# cross section legend
xs_legend = mv.mlegend(legend_text_font_size=0.35)

# ---------------------------------------------
#  Map view with z500 and cross section line
# ---------------------------------------------

# define coastlines
coast = mv.mcoast(
    map_coastline_colour="RGB(0.4449,0.4414,0.4414)",
    map_coastline_resolution="low",
    map_coastline_land_shade="on",
    map_coastline_land_shade_colour="RGB(0.5333,0.5333,0.5333)",
    map_coastline_sea_shade="on",
    map_coastline_sea_shade_colour="RGB(0.7765,0.8177,0.8941)",
    map_boundaries="on",
    map_boundaries_colour="mustard",
    map_boundaries_thickness=2,
    map_grid_colour="RGB(0.2627,0.2627,0.2627)",
    map_grid_latitude_increment=5,
    map_grid_longitude_increment=5,
)

# define map view
gview = mv.geoview(
    map_area_definition="corners",
    area=[25, -84, 40, -60],
    coastlines=coast,
    subpage_y_lenght=75,
)

# define contouring for z500
cont_z = mv.mcont(
    contour_line_thickness=2,
    contour_line_colour="black",
    contour_highlight="off",
    contour_level_selection_type="interval",
    contour_interval=4,
    grib_scaling_of_derived_fields="on",
)

# map title
map_title = mv.mtext(text_lines="Z 500 hpa", text_font_size=0.4)

# cross section line visualiser
vis_line = mv.input_visualiser(
    input_plot_type="geo_points",
    input_longitude_values=[line[1], line[3]],
    input_latitude_values=[line[0], line[2]],
)

graph_line = mv.mgraph(graph_line_colour="red", graph_line_thickness=4)

# ---------------------------------------------
#  Define layout
# --------------------------------------------

map_page = mv.plot_page(bottom=30, view=gview)

xs_page = mv.plot_page(top=30, view=xs)

dw = mv.plot_superpage(pages=[map_page, xs_page])

# ---------------------------------------------
#  Generate plot
# --------------------------------------------

# define the output plot file
mv.setoutput(mv.pdf_output(output_name="cross_section_wind_unprojected"))

# generate plot
mv.plot(
    dw[0],
    f_z,
    cont_z,
    vis_line,
    graph_line,
    map_title,
    dw[1],
    f_r,
    r_shade,
    f_uv,
    wind_style,
    xs_title,
    xs_legend,
)