Try this notebook in ![]() .
.
Computing and plotting wind speed (GRIB)
In this notebook we will demonstrate how to:
extract wind components on the 500 hPa pressure level
compute the wind speed
change the GRIB header in the resulting fields
plot the results
[1]:
import metview as mv
First, we retrieve the wind forecast data from MARS for a set of pressure levels and forecast steps on a 5x5 degree regular latlon grid. Alternatively we can read these fields from disk.
[2]:
use_mars = False # if False, then read data from disk
[3]:
if use_mars:
    g = mv.retrieve(type='fc',
                date = -1,
                time = 12,
                param = ['u','v'],
                levelist = ['500', '1000'],
                levType = 'pl',
                step = [0, 6, 12, 18],
                grid = [5, 5])
else:
    filename = "data_uv.grib"
    if mv.exist(filename):
        g = mv.read(filename)
    else:
        g = mv.gallery.load_dataset(filename)
The result is a Fieldset, which is Metview’s own class to represent GRIB data. We can check the contents of our fieldset with grib_get(), which can extract a set of metadata keys from the GRIB header.
[4]:
mv.grib_get(g, ['shortName', 'level', 'step'])
[4]:
[['u', '500', '0'],
 ['v', '500', '0'],
 ['u', '1000', '0'],
 ['v', '1000', '0'],
 ['u', '500', '6'],
 ['v', '500', '6'],
 ['u', '1000', '6'],
 ['v', '1000', '6'],
 ['u', '500', '12'],
 ['v', '500', '12'],
 ['u', '1000', '12'],
 ['v', '1000', '12'],
 ['u', '500', '18'],
 ['v', '500', '18'],
 ['u', '1000', '18'],
 ['v', '1000', '18']]
Next, we filter the 500 hPa wind components using the read() function.
[5]:
u = mv.read(data=g, param='u', levelist='500')
v = mv.read(data=g, param='v', levelist='500')
Having extracted the wind components we compute the wind speed fields using Metview’s high level fieldset arithmetic.
[6]:
sp = mv.sqrt(u*u + v*v)
We can see that in the results the paramId and the corresponding shortName still refer to the u wind component.
[7]:
mv.grib_get(sp, ['shortName', 'paramId','level', 'step'])
[7]:
[['u', '131', '500', '0'],
 ['u', '131', '500', '6'],
 ['u', '131', '500', '12'],
 ['u', '131', '500', '18']]
The reason for this is that Metview always copies the metadata of the first field in the expression into the resulting field. When we plot fields, the automatic contouring and title are based on the paramId. So it is generally a good idea to set it correctly. We will do it by using the grib_set_long() function (changing the paramId will set the shortName automatically).
[ ]:
[8]:
sp = mv.grib_set_long(sp, ['paramId', 10])
mv.grib_get(sp, ['shortName', 'paramId','level', 'step'])
[8]:
[['ws', '10', '500', '0'],
 ['ws', '10', '500', '6'],
 ['ws', '10', '500', '12'],
 ['ws', '10', '500', '18']]
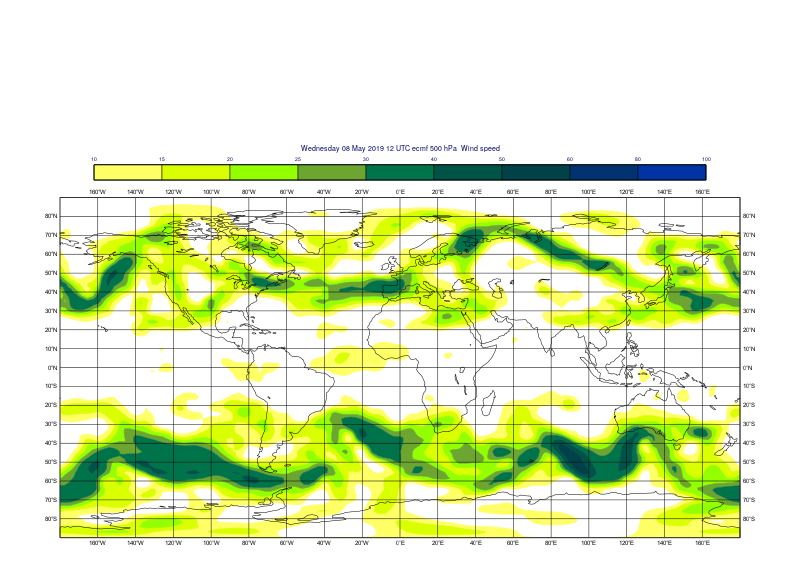
Finally, we plot the first windspeed field using automatic contouring and title settings.
[9]:
mv.setoutput('jupyter')
mv.plot(sp, mv.mcont(contour_automatic_setting='ecmwf', legend='on'))
[9]: