Version 4.3 Updates
User Version 4.3.11
Upgrade 2013-09-17 (Linux desktops, lxab cluster, ecgate)
Version 4.3.11 became User Version (command metview4) at ECMWF
Test Version 4.3.11
Introduced 2013-07-08 (Linux desktops, lxab cluster, ecgate)
Installed as metview4_new
Macro: added a vector function to return a vector of sorted indices from a vector:
vector sort_indices(vector)
vector sort_indices(vector, string)

Sorts a vector and returns the sorted indices. The default
behaviour is to sort in ascending order unless an alternative
comparison function is provided. A second argument consisting of a
string can be given: '<' for ascending, '>' for descending order.
FLEXTRA: Metview’s FLEXTRA modules can now run with 137-level model level data
ODB: built with ODB_API version 0.9.31
GRIB: built with GRIB_API 1.11.0
MARS: rebuilt with the latest MARS client code
Magics: rebuilt with latest Magics 2.18.16 (includes an improvement in the legend for marker shading)
Export Version 4.3.10
External release 2013-05-28
Version 4.3.10-export became available. Anyone using version 4.3.8 should immediately upgrade to 4.3.10.
Test Version 4.3.10
Introduced 2013-05-28 (Linux desktops, lxab cluster, ecgate)
Installed as metview4_new
Macro: fixed issue where passing a relative path to a data file was not correctly interpreted by the module which received it
Macro: function tolist() now accepts a list as an input type; in this case it simply returns a copy of the input list. This function is normally used for converting a vector into a list, but it is now safe to pass it a list.
Macro Editor: fixed issue where dropping a Table Visualiser icon into the Macro Editor did not produce exactly the correct code
UI: Macro icons are now allowed as input into icon editors which accept data (GRIB, BUFR, GEOPOINTS and NETCDF) icons. Examples would be a Cross Section Data icon or a Simple Formula icon.
User Version 4.3.9
Upgrade 2013-05-21 (Linux desktops, lxab cluster, ecgate)
Version 4.3.9 became User Version (command metview4) at ECMWF
Export Version 4.3.9
External release 2013-05-16
Version 4.3.9-export became available. Anyone using version 4.3.8 should immediately upgrade to 4.3.9.
Test Version 4.3.9
Introduced 2013-05-15 (Linux desktops, lxab cluster, ecgate (on 2013-05-16))
Installed as metview4_new
Macro: fixed a critical issue where non-temporary GRIB files could be deleted. This could occur when passing the result of a merged fieldset (e.g. a = b & c) to an icon-function (e.g. read() using the MARS filtering syntax).
Test Version 4.3.8
Introduced 2013-05-08 (Linux desktops, lxab cluster, ecgate)
At ECMWF:
Installed as metview4_new
Built with Magics 2.18.16
Built with updated Mars client code
Built with ODB_API version 0.9.28
ODB Data Probe: fixed issue where this was not showing the correct values when the plot was zoomed
Macro: fixed issue where temporary GRIB files were sometimes not cleared from the temporary directory
Macro: fixed issue where the area selection helper tool did not appear when invoked from a user’s Macro-generated dialog
Macro: Improved performance when extracting a long list member from a definition variable
Performance when handling large numbers of Gaussian grid GRIB fields has been improved
Lambert: fixed issue where Metview’s built-in macro functions for finding the nearest grid point in a Lambert projection GRIB field failed
Macro Editor: changed drag & drop behaviour - when an icon is dropped into a Macro Editor, the generated code is now placed where the drop was aimed (the previous behaviour was to place the code at the text cursor’s current position)
Macro Editor: improved the layout of code generated when an icon is dropped into the editor; only when the tab settings are set to use spaces instead of tabs (Settings menu)
Meteogram: added option to return a 15-day meteogram with climatology. Note that setting Data Selection Type to Latest does not currently function.
Grib Examiner: fixed issue where closed instances could stay in memory and consume CPU time
Reprojection: fixed issue where the reprojection module was not working on ecgate
Cartesian View: updated the icon graphic used for the Cartesian View
Single Column Model:
data from CY38R2 now works with the SCM icons
icons and tables updated to handle L137 data
ensured that the Scm Run icon works when given netCDF files with spaces in their filenames
ensured that the Scm Run icon can write its output file to a directory relative to the icon’s location
fixed issue where error messages were not printed in the log window for the Scm Run icon
added level range and value range control per parameter for profile plotting in the Scm Data Editor
added step control buttons to the Scm Data Editor
added button to the Scm Data Editor to propagate changes to other time steps
the Scm Data Editor now saved modified surface data
the Scm Data Editor now adjusts its axis tick interval properly to the value range
the Scm Data Editor’s plot is now updated if a data point is dragged out of the plot frame
option added to the Scm Visualiser icon to allow the plotting of grid lines
the Scm Visualiser icon now plots a pressure axis on the right-hand side when the vertical axis is in model levels
the Scm Visualiser icon now allows user-defined min/max value ranges for the matrix plotting mode
Installation: fixed small issue detecting the installed Magics version
Export Version 4.3.7
External release 2013-03-11
Version 4.3.7-export became available.
NOTE: Requires Magics++ version 2.18.2
User Version 4.3.7
Upgrade 2013-03-11 (Linux desktops, lxab cluster, ecgate)
Version 4.3.7 became User Version (command metview4) at ECMWF
Note: the user version was reverted to 4.3.3 on 2012-03-12 because of incompatibilities with a particular plot. This is under investigation.
Test Version 4.3.7
Introduced 2013-02-26 (Linux desktops, lxab cluster, ecgate)
Installed as metview4_new
Built with updated Magics library. See the Magics Change History.
GRIB Filter icon now saves the MARS parameter short name (e.g. ‘t’) instead of the number (e.g. 130)
Fixed issue where the legend for coloured wind in the Grib Vectors icon became corrupted when moving between fields
Layer metadata histogram in the Display Window once again allows the use of the current visdef
Improved logging (only of interest to the maintainer)
Fixed instability issue in the GRIB Examiner (hotfix applied 2013-03-08)
Test Version 4.3.6
Introduced 2013-02-19 (Linux desktops, lxab cluster, ecgate)
Installed as metview4_new
Built with Magics 2.18.13 See the Magics Change History.
Fixed issue where netCDF matrix plots with a vertical date/time axis were empty
This also fixed the Forward setting of the Hovmoeller plots
Fixed issue in the Velocity Potential / Stream Function module where the parameters in GRIB 2 data were not being correctly identified
The SCM Visualiser now allows user-defined legend titles
The colour scales in the Profile option in the SCM Visualiser have been improved
New function added to the Metview Macro Library mvl_geoline. This function can be used to draw geographical lines on a map regardless of projection
Test Version 4.3.5
Introduced 2013-01-28 (Linux desktops, lxab cluster, ecgate)
Installed as metview4_new
Built with Magics 2.18.9
Support for ECMWF Single Column Model data - new facilities to
examine and edit (modify) an input netCDF file
define a namelist file for SCM
run SCM using a given executable, input netCDF file and namelist
visualise the output data and compare runs
see the short tutorial: The SCM Interface in Metview - Tutorial
Macro: added new function
dimension_names(). Description:list dimension_names(netcdf)returns a list of the dimension names for the current netCDF variable.
Improved efficiency (significantly) of Average Data icon
Improved HTML-style text in interactive (Qt) plotting
Fixed issue where DivRot module was failing with ECMWF GRIB 2 data
Fixed issue where Table Visualiser and NetCDF Visualiser icons could become corrupted
Fixed issue where the area selection button in the FLEXTRA Prepare icon did not work
Update: added a default y-axis title on Cross Section, Average Data and Vertical Profile plots
Update: added new parameter to the NetCDF Visualiser:Netcdf Dimension Setting. This parameter allows the slicing of multidimensional variables. For instance, if there is a variable with dimensions (time, level) then it is possible to plot just the values at a specific time by setting this parameter to, for example, time/1800. Note that this parameter’s syntax has not been finalised.
Fixed issue where the font size on the line numbering area of the Macro Editor was inconsistent
Updated list of WMO stations used by the Stations icon
Export Version 4.3.4
External release 2012-10-29
Test Version 4.3.4
Introduced 2012-10-29 (Linux desktops, lxab cluster, ecgate)
Installed as metview4_new
Built with Magics 2.18.1 See the Magics Change History.
Fixed issue where ObsFilter was not working with Level=Occurrence
Fixed issue where Cross Section was producing an empty plot when transect line was of constant longitude
Fixed issue where Cross Section was producing an empty plot when given data in model levels with LNSP
Fixed issue where the Data Examiners would remain active after their Metview session had been closed, occasionally consuming large amounts of CPU time
Fixed issue where the Display Window crashed if the metadata sidebar was open when plotting grid values
Reorganised the sidebar’s content in the Display Window. The Layers tab now only contains the layer list and a new tab called Data was added for the layer data. By selecting the Data tab users are able to see metadata and data values associated with the selected layer.
New feature: added the ability to shade the area between two curves with the Input Visualiser (Input Plot Type = XY Area)
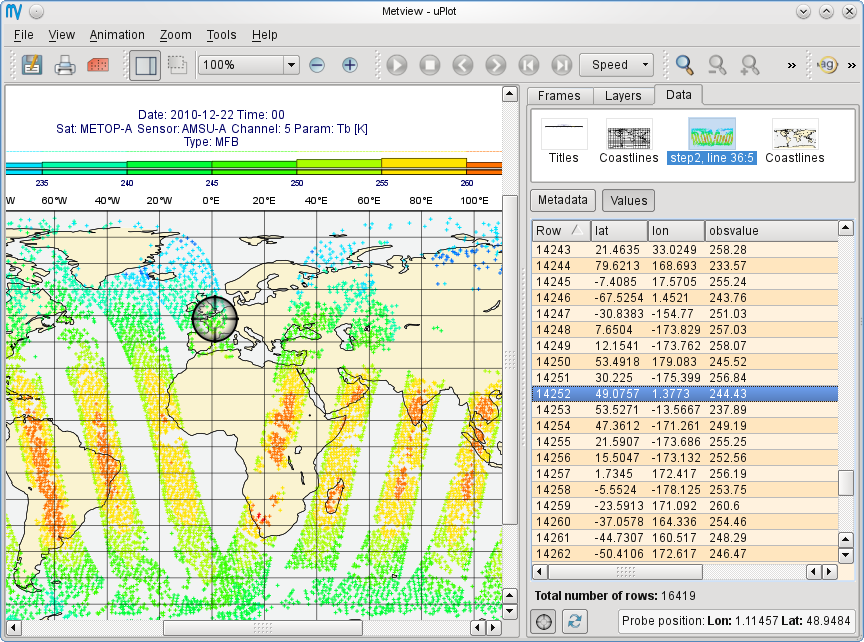
New feature: ODB data probe. From the Display Window, select the Data tab, then click the Values button to show the data values for the current plot area. An icon at the bottom-left of this tab activates the data probe, which is a movable on-screen probe; as it is positioned over a data point, the corresponding row in the data table is highlighted. Conversely, if a row in the data table is highlighted, the data probe is automatically positioned over the corresponding point on the map.
New feature: enabled ODB Visualiser to save additional columns to the resulting ODB. A parameter called ODB_METADATA_VARIABLES was added to the ODB Visualiser. The columns specified here will be added to the ODB Visualiser’s output on top of the lat/lon/value etc. columns. These extra columns can then be examined in the Display Window’s Data/Values tab.
New feature: added show/hide columns option to the Data tab of the ODB Examiner
New feature: added expression support for column variables in the ODB Visualiser. Previously the column variables in ODB Viusaliser could strictly take column names. Now arbitrary ODB expressions/functions can be used for them, e..g. by setting ODB_VALUE_VARIABLE to an_depar-fg_depar will result in plotting of the difference between the analysis and first guess departures.
Alphabetically sorted columns in the Data tab of the ODB Examiner
Plotting speed has been improved in the interactive Display Window
New environment variable: METVIEW_EXTRA_GRIB_DEFINITION_PATH. Metview now understands a new environment variable which users can use to specify a directory where custom GRIB_API definition files are stored. METVIEW_EXTRA_GRIB_DEFINITION_PATH should be set before starting Metview.
New Macro function:
grib_get()for the efficient retrieval of multiple GRIB keys from a fieldset.
User Version 4.3.3
Upgrade 2012-09-18 (Linux desktops, lxab cluster, ecgate)
Version 4.3.3 became User Version (command metview4) at ECMWF
Test Version 4.3.3
Introduced 2012-09-13 (Linux desktops, lxab cluster, ecgate)
Installed as metview4_new
Built with Magics 2.16.2 See the Magics Latest News - archive.
The Macro function read() can now read a Macro file, returning a list of strings, one per line of text. This is the same behaviour as already existed for reading general ASCII text files.
Improved the Display Window’s Cursor Data for very small values (if the values are very small, it switches to scientific notation).
Installation: fixed an issue where a custom startup script name was causing the build to fail in the scripts directory
NOTE: this is the version that will become the user version at ECMWF on Tuesday 18th September 2012, 09:00 GMT.
Export Version 4.3.2
External release 2012-08-14
Version 4.3.2-export became available. See the Releases page for download.
Built with latest Mars client code
Installation: issue with detecting the Magics library resolved
Installation: issue with building Qt modules on certain systems (e.g. Ubuntu 12.04) resolved
NOTE: Requires Magics++ version 2.16.1 in order to build the Qt/Magics-based plotting module - see the Magics Releases page
Test Version 4.3.1
Introduced 2012-08-06 (Linux desktops, lxab cluster, ecgate)
Installed as metview4_new
Built with Magics 2.15.8
New Macro function sort(vector, string) returns a sorted version of the given vector. If no second argument is given, the result will be sorted in ascending order; otherwise, a second argument consisting of a string can be given: ‘<’ for ascending, ‘>’ for descending order. See Vector Functions.
Macro: fixed issue when reading floating-point netCDF attributes - there had been occasions where very large numbers had some digits cropped . This only affected attributes which were floating point, and not actual data values.
Macro Editor: ‘find/replace’ actions now wrap around
Test Version 4.3.0
Introduced 2012-07-16 (Linux desktops, lxab cluster, ecgate)
Installed as metview4_new
Built with Magics 2.15.7
New module: Grib Vectors - similar to Metview 3’s Vectors module. The purpose is to tell Metview to plot given pairs of fields as vectors. Also allows for the colouring of the arrows by a third field.
Improved automatic recognition of vector fields, including wave ields
New module: Opera Radar Filter - new module for the purpose of reading OPERA radar BUFR messages and converting the data to geopoints format.
ObsFilter module: extended level filter to work with arbitrary coordinate descriptors. The level filter in ObsFilter has so far only allowed surface or pressure level/layer selection. Now two new options were added to the level filter so that it could work for any kind of coordinate descriptors (e.g. height, satellite channel etc). These two new options are follows:
Descriptor Value: If Level is set to Descriptor Value then ObsFilter performs level filtering according to the descriptor specified in Level Descriptor. The level value is taken from parameter First Level.
Descriptor Range: If Level is set to Descriptor Range then ObsFilter works similarly but selects the first available level in the specified range. The level range is taken for parameters First Level and Second Level.
New macro function: filter(vector, vector) - takes two vectors, and returns a new vector containing only the values of the first vector where the second vector’s values are non-zero and non-missing. See Vector Functions.
Plotting: added parameter LEGEND_TITLE_ORIENTATION to the Legend icon - Horizontal/Vertical
Macro: added optional ‘resize’ parameter to set_values(fieldset, vector) - if the user wants to create a new fieldset from a template, they may wish to change the number of values. The default behaviour is to produce an error if the input fieldset and vector have different numbers of values. If, however, a third parameter (set to the string ‘resize’) is passed to the function, the resulting fieldset will instead be resized to have the same number of values as the input vector.
Geo To Grib module: fixed issue in determining the size of the resulting grid. Also more checks to ensure the consistency of the requested grid (e.g. if grid resuolution matches the size of the domain)
Fix in
stdev()(fieldset) macro function (inherited from Mars code)Macro editor: improved visual display of whitespace characters (available from the Settings > Tabs menu)
Fix in the setting of a plot area in Lambert projection
Updated mvl_ml2hPa() to properly encode levels < 1 hPa
Removed code for handling computations with GRIB fields stored in polar stereographic grids. This does not affect the plotting of data onto a polar stereographic map.
Smaller fixes and improvements