Version 5.15 Updates
Version 5.15.1
Externally released on 2022-03-06
Not deployed at ECMWF
Fixes:
Fixed build issue on macOS
Version 5.15.0
Externally released on 2022-03-03
Became metview/new at ECMWF on 2022-03-03 (Linux desktops, ecgate, lxc, lxop)
At ECMWF:
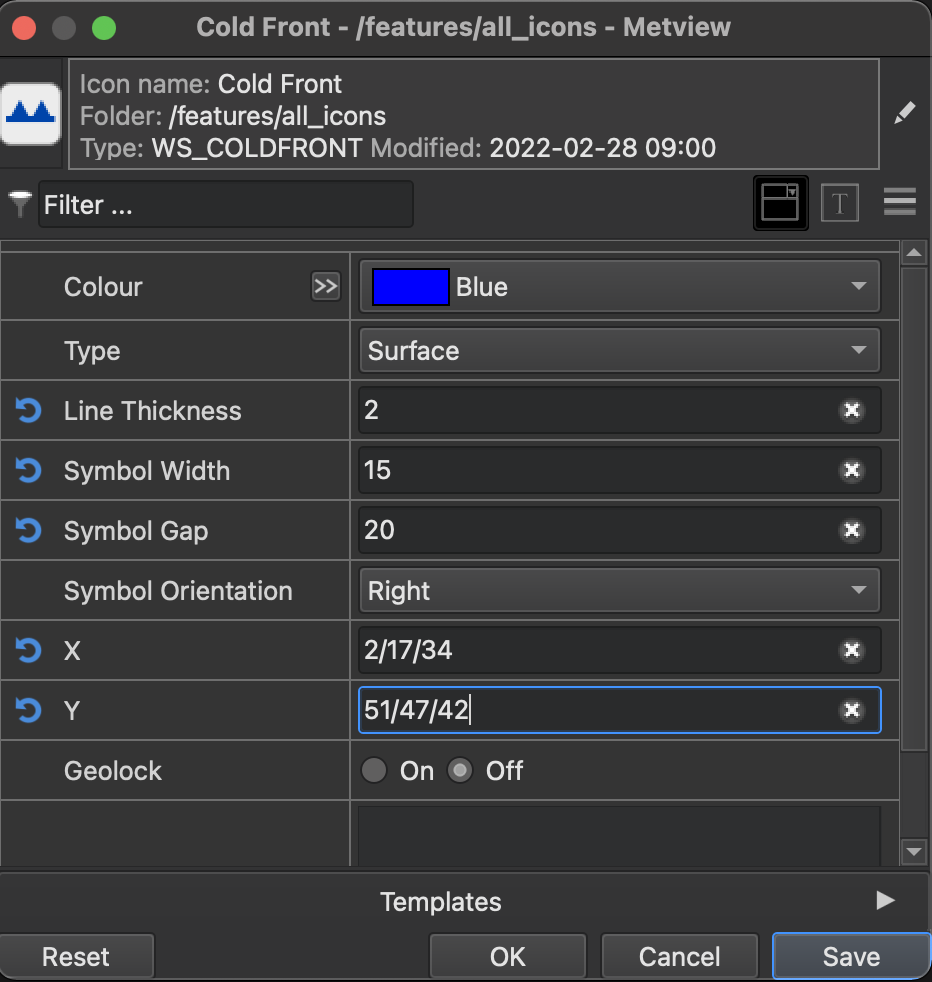
Weather Symbol Objects
There were several improvements for the Weather Symbol Objects.
Each Weather Symbol Object is now represented by a Metview icon (see the full list of icons here). These icons can be directly visualised or dragged into the plot window. Plotting from a script (Python or Macro) is possible with some restrictions as described here.
Using the icons the symbols can be saved from the Metview plot window for later reuse. To help the Weather Symbol management the User Library sidebar was added to the plot window:
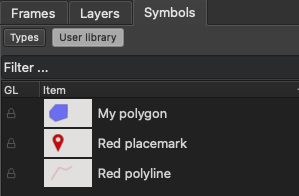
The whole scene of Weather Symbols (i.e. all the Weather Symbols in a plot view) can be saved as a collection.
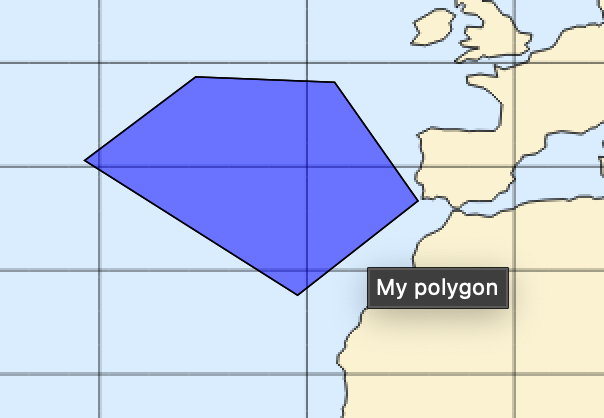
The way to add user defined images was refined and improved (see here).
The geolocked parameter was added to all the symbols to prevent accidental move when on screen editing.
The tooltip parameter was added to all the symbols to display a tooltip when the object is hovered over on screen.
Macro/Python
create_geo()now supports a list containing numpy.nan values as inputGeopoints now supports missing values in the elevations column
fixed failure when extracting a subset of a float32 vector in Macro when the default type is float64 - and vice-versa
fixed issue where extracting latitudes and longitudes of a GRIB on a reduced Gaussian grid sub-area caused a crash
fixed issue where calling the WmsClient in a batch script caused a failure due to a bad _PATH parameter
Plotting
added new paramteter map_user_layer_land_colour to
mcoast()to enable and control the shading of user-supplied shapefiles as part of the coastlines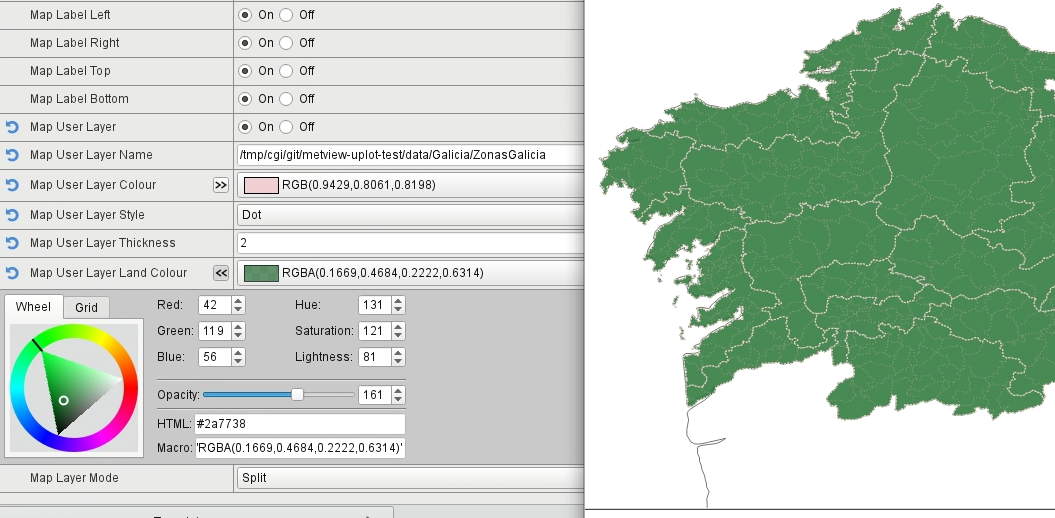
added EPSG:32661 and EPSG:32761 to list of available projections
updated list of built-in areas to match the latest defined in Magics
Regrid
added
Geopointsas possible input data typeadded TARGET parameter in order to directly specify where the output file should go
new interpolation method k-nearest neighbours statistics (use with interpolation statistics for maximum/minimum, mode, median, standard deviation, etc.)
new distance weighting method reciprocal (use with interpolation k-nearest neighbours to control how to weight source points according to their distance from the target point)
Meteogram
The
meteogram()module now uses the new infrastructure to retrieve its plots
Display Window
fixed issue where a long filename in a GRIB (or other data) file could cause problems when resizing the sidebar in the Display Window
fixed issue where the sidebar in the Display Window took up too much space on first startup
fixed issue where the Display Window could crash if loading a key profile containing unsupported key names
GRIB and BUFR Examiners
GRIB Examiner now displays both the native value and the string value in the namespace dumps
the BUFR Examiner now displays “missing” for missing string values
the BUFR Examiner now uses the first two columns for searching in the Descriptors tab
fixed issue where the GRIB Examiner message list did not update correctly when the key profile is changed
Desktop UI
fixed an issue where the Desktop main user interface could crash if a user deleted a non-empty folder