Version 5.7 Updates
Version 5.7.5
Externally released on 2020-01-14
Became metview/new at ECMWF on 2020-01-14 (Linux desktops, ecgate, lxc, lxop)
At ECMWF:
Fixes:
fixed issue where regridding of previously retrieved spectral U/V fields was not taking into account the latitude weighting
fixed issue where the BUFR filtering in the Bufr Picker icon and the Bufr Examiner did not correctly handle the case where the coordinate value was missing
fixed issue where FLEXPART Prepare could fail with a “missing level” error
fixed issue where the ml_to_hl function failed when run from Python
fixed issue where netCDF data with values encoded as unsigned short (ushort) could not be read
fixed issue where the Contouring icon did not allow the parameter Contour Reference Level to be set if parameters Contour or Contour Highlight were “Off”
fixed issue in the Table Reader where Table Column Types only worked with uppercase “STRING”; now it works with any case
improved the inline editor tips for the Table Reader
fixed issue running the “metview -p /path/to/file” command to plot a file directly from the command line
fixed issue where a first-time startup of Metview on MacOS 10.15 would fail to create the default user directory
Version 5.7.4
Externally released on 2019-12-06
Became metview/new at ECMWF on 2019-12-09 (Linux desktops, ecgate, lxc, lxop)
At ECMWF:
Fixes:
fixed issue where the Percentile module did not correctly handle missing values in the input data. Added a new parameter:
compute_if_missing: ‘on’ (this is the default)
for each grid point, the percentiles are computed using only the non-missing values
compute_if_missing: ‘off’
for each grid point, if there are any missing values, the result will be a missing value
fixed issue where the main user interface crashed if a Macro Parameters icon is run more than once
fixed issue in FLEXPART Run module when dealing with high resolution grids
fixed issue where the FLEXPART trajectory output file is not correctly parsed
added macro function to convert raw trajectory output to Metview CSV format. The function is as follows:
flexpart_convert_trajectory(raw_tr_file, outprefix)
The ASCII file generated by FLEXPART (raw_tr_file) is split according to releases and converted into a CSV format that is better suited to Metview.
The output filenames are as follows: outprefix_rRRR.csv where RRR is the release number (starts from one) with leading zeros.
Version 5.7.3
Externally released on 2019-11-28
Became metview/new at ECMWF on 2019-11-28 (Linux desktops, ecgate, lxc, lxop)
At ECMWF:
Fixes:
fixed issue where NetCDF variables encoded with signed byte arrays were not properly handled
fixed issue with the title generated from plots of FLEXPART data when the time steps are smaller than one hour
fixed issue with the RPMs not finding the correct libraries
implemented small change in Magics 4.2.3 that could help overcome a rare problem where text appeared upside down in the interactive plot window
if you experience this problem, please ensure that you use Magics 4.2.3, and set the environment variable MV_FORCE_TEXT_PEN=1 before starting Metview, and please give us your feedback!
Version 5.7.2
Externally released on 2019-11-06 (get the 5.7.2.1 tarball to avoid an unnecessary message being printed when importing Metview’s Python module)
Became metview/new at ECMWF on 2019-11-06 (Linux desktops, ecgate, lxc, lxop)
At ECMWF:
Fixes:
fixed issue where the title of a cross section could show the wrong parameter
fixed issue where the function surrounding_points_indexes() gave a wrong result when the longitude of the target point was 360 and the grid was reduced Gaussian
fixed issue where the Thermo Data module could write null time values into its result if the input was BUFR
fixed issue where the Observation Filter did not correctly handle BUFR data with empty station IDs
fixed issue where Metview’s MARS client module generated suplerfluous messages when run
Version 5.7.1
This was just a rebuild of Metview on ECMWF’s HPC with plotting enabled.
Version 5.7.0
Externally released on 2019-10-04
Became metview/new at ECMWF on 2019-10-04 (Linux desktops, ecgate, lxc, lxop)
At ECMWF:
Desktop:
fixed crash in the Contouring icon editor on macos
Macro/Python:
it is now possible to view the online documentation in a web browser for all the functions/icons listed in the Code Editor sidebar:
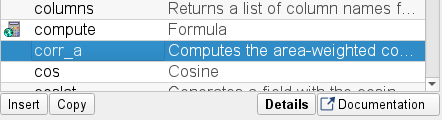
A detailed description about the usage of the the Code Editor sidebar was made vailable at: Integrated help in the Code Editor
geopoints functions create_geo() and set_dates() now accept date variables in Macro or datetime variables in Python
geopoints can now have missing values for latitudes and longitudes, and they will be ignored by most operations
new geopoints function: mask()
new fieldsets function: ml_to_hl(…) - interpolates fieldsets from model levels to height levels above ground or sea level
new function: percentile(vector)
p = percentile(vdata, |2, 99, 60|) # compute 2nd, 99th and 60th percentiles of vdat
the grib_get_xxx() functions no longer print warning messages if the requested key does not exist (they return nil/None, which can be checked)
fixed issue where the nearest_gridpoint() function did not produce correct results with certain reduced Gaussian grids on sub-areas
Plotting:
added new option called **Map Layer Mode **to the Coastlines icon to control how the map is rendered into the foreground or/and background of the plot. The possible values are as follows: split, foreground, background.
added new context menu option to the icons in the Layer sidebar, “Save as” to save a copy of visdef icons modified directly in the plot window
fixed issue when the polar_north and polar_south projections resulted in empty plots when specified via certain corner coordinates.
MARS:
set the environment variable METVIEW_MARS_LOG=1 before starting Metview in order to obtain useful logging information from the MARS client without setting -slog
BUFR:
the BUFR Examiner contains a new tab called “Descriptors” showing all the expanded descriptors (only metadata) of the given message.
Spectra:
fixed issue where the Spectra module produced an empty plot
Percentile:
the Percentile module (that acts on GRIB data) previously had a restriction that the number of percentiles computed could not exceed the number of fields in the GRIB data. This restriction has now been lifted.
Potential Temperature:
fixed issue where the Potential Temperature module could not be run with the -nofork option