Version 5.13 Updates
Version 5.13.2
Not externally released.
Became metview/new at ECMWF on 2021-09-29 (Linux desktops, ecgate, lxc, lxop)
No changes in this version - installed at ECMWF as a ‘container’ for metview-python 1.8.1 - see: Metview Python Release Notes
Version 5.13.1
Externally released on 2021-09-16
Not installed at ECMWF, as there is no need
Startup:
fixed an issue seen on macOS platforms using Qt5 where Metview’s user interface does not start up unless the user does this before starting Metview:
export QT_MAC_WANTS_LAYER=1
with Metview 5.13.1, this is no longer necessary
Version 5.13.0
Externally released on 2021-08-26
Became metview/new at ECMWF on 2021-08-25 (Linux desktops, ecgate, lxc, lxop)
At ECMWF:
Macro/Python:
new function
shear_deformation()- computes the shear deformation of vector fields. See the gallery example.new function
stretch_deformation()- computes the stretch deformation of vector fields. See the gallery example.new function
virtual_temperature()- computes the virtual temperature.new function
specific_humidity_from_dewpoint()- computes the specific humidity from dewpoint temperature.new function
pressure_derivative()- computes the vertical pressure derivative.GRIB functions
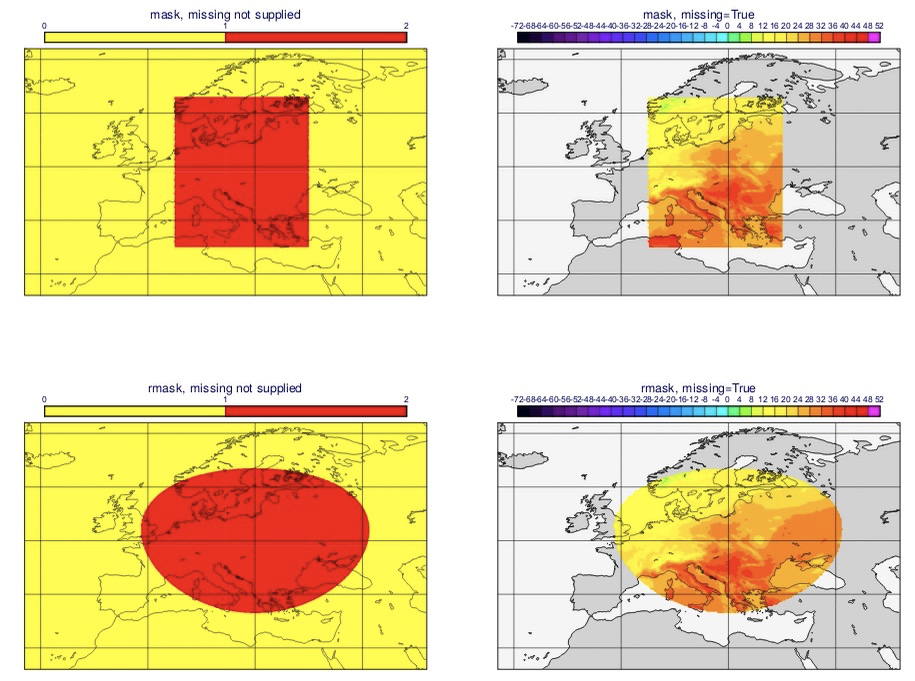
mask()andrmask()now accept an additional argument to change their behaviour. By default, any values outside the specified area become zeros and any values inside the area become ones. When the new option is supplied, any values outside the area become missing values, and any values inside the area are untouched, so it acts similar to a cropping tool. Example Macro and Python code to activate this:# Macro: a = mask(data, area, "missing")
# Python:
import metview as

a = mv.mask(data, area, missing\ =\ True)
See also the gallery example
allow
interpolate()function on GRIB to work with arrays of coordinates. In Macro, this function can now take vectors of lats and lons, and in Python it can take numpy arrays of lats and lons. For multiple fields, this will return a list of vectors/arrays, and for a single field it will return a single vector/array.result = interpolate(grib, lats, lons)
fixed issue where
univertint()resulted in incorrect sign of values for pressure level datafixed issue where the result of merge(fs[4], fs[5]) was not properly passed to
read()andregrid()functionsimproved the error message if the
examine()function is called when the user interface has not been built
Example of the different mask modes:
Plotting:
it is now possible to define a polar_streographic projection in
geoview()by a centre point and scale. See the gallery example.import metview as mv view = mv.geoview( map_projection="polar_stereographic", map_area_definition="centre", map_vertical_longitude=20, map_centre_latitude=47, map_centre_longitude=20, map_scale=1e7 )
parameter ‘map_vertical_longitude’ is now available for projections ‘polar_north’ and ‘polar_south’
new method of specifying how to thin wind arrows in a plot in terms of density (number of arrows or flags per cm). This method allows for a more consistent plot, regardless of the data resolution or the zoom area. These are the two methods, shown with Python code:
import metview as mv

# plot 4 wind arrows per cm of plot space (within the limits of the data resolution)
wdef = mv.mwind(wind_thinning_method="density", wind_density=4) # default is 5

# plot a window arrow for every 3rd data point
wdef = mv.mwind(wind_thinning_method="thinning", wind_thinning_factor=3) # default is 2
fixed issue where missing values in geopoints data were included in the statistics in the Display Window sidebar, causing erroneous statistics to be displayed (requires Magics 4.9.0)
fixed issue where a plot command containing hundreds of plots failed with the following error message:
Python - ERROR - 20210719.142149 - Line 0 in ‘PythonScript’: Stack is full
the cause was a limit on the number of arguments that a function could take; this limit has now been multiplied by six
removed the unused parameters in the NetCDF Visualiser icon ‘netcdf_x_position_variable’ and ‘netcdf_y_position_variable’
see also the new features in the Python interface here: Metview Python Release Notes
Regrid:
the Regrid module has a new interpolation method: Voronoi statistics
DivRot:
The divrot function / Rotational or Divergent Wind icon has gained parameters to specify the paramIds of the divergence and vorticity fields:
divergence_param (default=155)
vorticity_param (default=138)
User Interface:
support for Qt 6 (Qt 5 still supported too)
this change requires a compiler capable of the C++17 standard
fixed issue where menus’ keyboard shortcuts were not shown, symptoms only seen in Qt versions 5.10 to 5.12.3.
improved readability of icons and menus in the Display Window when run in dark mode on macOS
Startup:
when run with the -slog command-line option, the following information is now printed at the top of the output:
Metview version and installation directory
MARS definition files path
fixed issue where the call to xdpyinfo to check screen resolution caused an error on some systems due to its output being too large
small improvements to help with the native Ubuntu package (consistent use of METVIEW_DIR_SHARE and not require the dot files in the Getting Started folder to exist)