Version 5.3 updates
Externally released on 2018-12-05
Became metview/new at ECMWF on 2018-12-05 (Linux desktops, ecgate, lxc, lxop)
At ECMWF:
Highlights:
ecCharts icon: new icon, ecCharts, which gives access to ecCharts layers and styles through Metview. This means that pre-defined data layers used in ecCharts can be accessed through Metview, but for past or experimental data as well as recent data. Through the context menu, macros and Python scripts can also be generated from this icon.
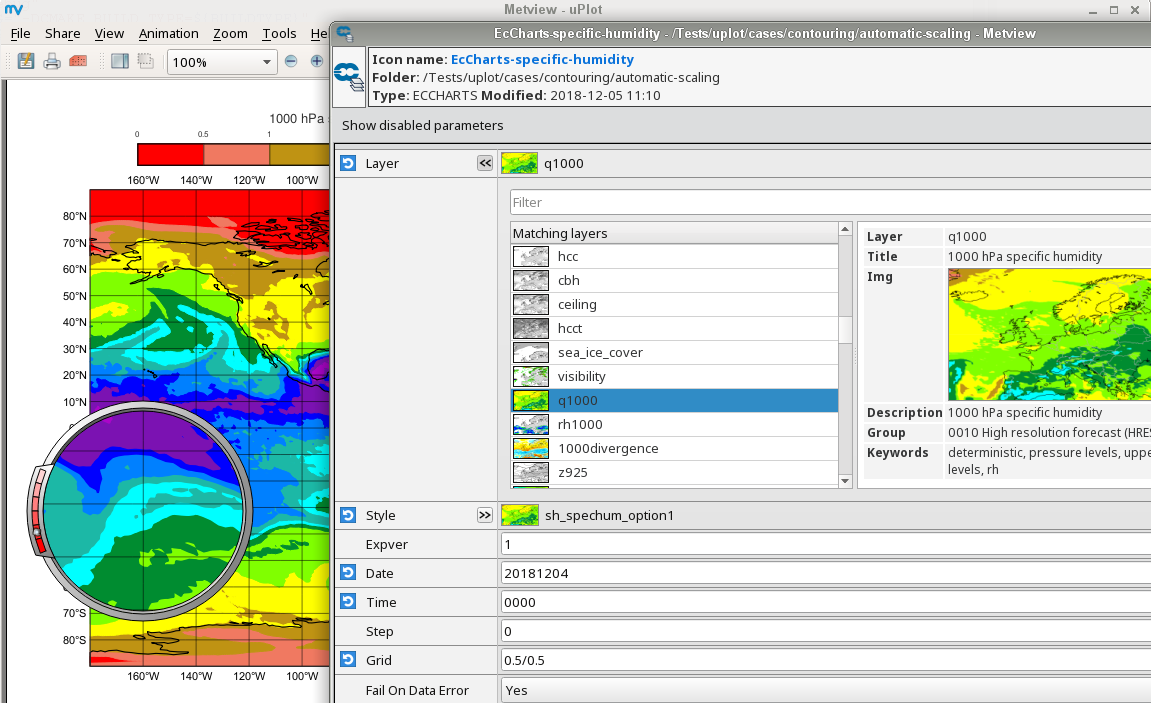
The ecCharts icon gives access to data layers and graphical styles defined in ecCharts
Other features and fixes:
General: improved error reporting, e.g. in cases where a plot command calls another module (e.g. Cross Section)
Plotting: plotting to file no longer accumulates memory between plots
Plotting: added Polar South projection to Geographical View
Met3D: fixed issue with retrieving LNSP data in Met3D Prepare icon
Python: fixed error message when indexing a fieldset with a bad index
Python: allow export of Tables to pandas dataframe
BUFR Filtering: improvement in performance in certain cases
BUFR Examiner: added context menu item to copy the name of the selected key to the clipboard
UI: simplified the filter for the contouring styles in the Contouring editor
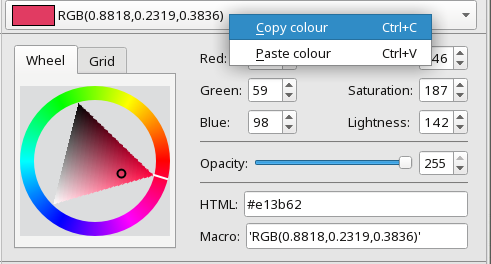
UI: icon editors now have ‘Copy colour’ and ‘Paste colour’ so as to share colour definitions via the clipboard
Build: fixed installation issue on Mac OSX