Version 5.11 Updates
Version 5.11.1
Externally released on 2021-04-27
Became metview/new at ECMWF on 2021-04-27 (Linux desktops, ecgate, lxc, lxop)
At ECMWF:
MARS:
fixed issue where MARS client could not retrieve observation data from the rdb (fix in mars-client code)
Macro/Python:
derivatives: error in second derivative finite backward difference computation affecting the functions
second_derivative_x(),second_derivative_y(),laplacian()
Plotting:
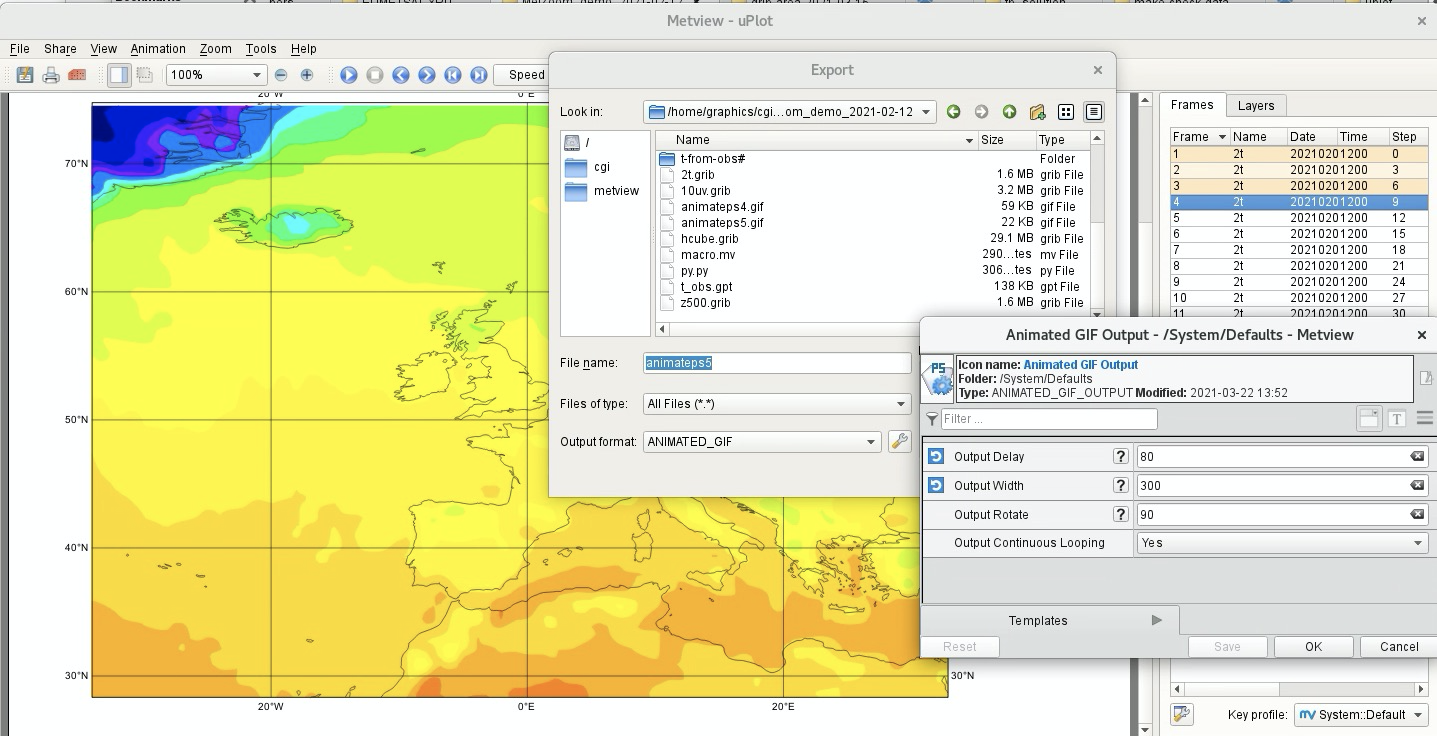
improvements in the animated GIF export dialogue, plus support for spaces in output filenames
Grib Examiner:
fixed a crash when duplicating a key profile
fixed issue where the namespace dump could be empty
WMS Client:
fixed issue when switching between interactive and plain mode
Packaging:
fixed issue where two ECMWF config files were not packaged in the source tarball (not required outside ECMWF)
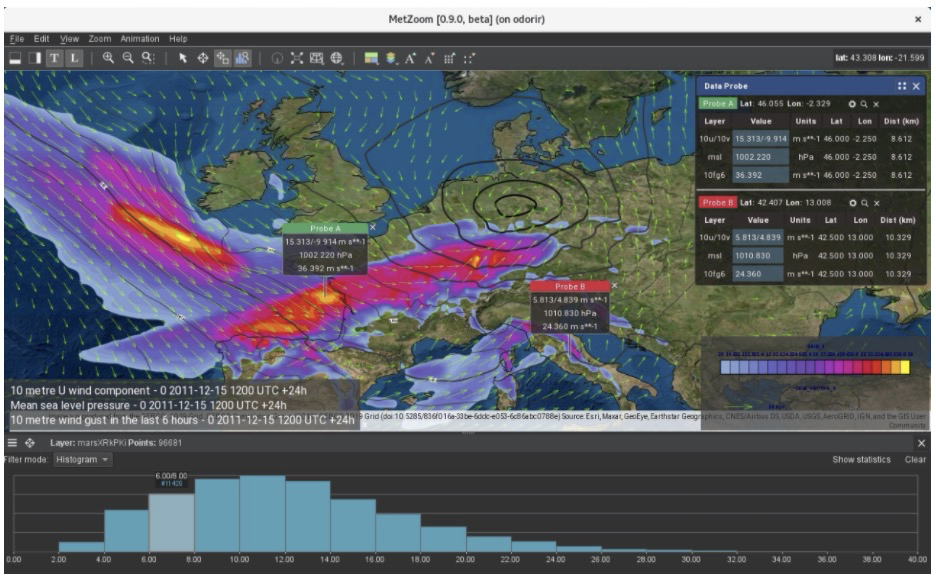
MetZoom:
fixed issue where MetZoom did not accept a relative path to data when started from command line
fixed crash when sorting in animation sidebar
fixed crash when viewing layer metadata in sidebar
Version 5.11.0
Externally released on 2021-03-24
Became metview/new at ECMWF on 2021-03-24 (Linux desktops, ecgate, lxc, lxop)
At ECMWF:
MetZoom:
The internal installation of Metview 5.11.0 at ECMWF contains a beta release of the new data exploration app MetZoom, which can be invoked by selecting a data icon in Metview and selecting MetZoom from the context menu (on the desktop systems only at the moment)
MetZoom is not yet available outside ECMWF and is considered a beta release, so feedback is welcome!
A getting started guide is here: MetZoom Documentation
Plotting:
the Export dialogue now has Animated GIF as an option. Note that this requires the ‘convert’ command from ImageMagick to be available on your system
the Export dialogue now defaults to the directory from where it was invoked
the Export dialogue now remembers the Current/All/Range frame selection
added new parameter axis_title_position to the Axis Plotting icon /
maxis()function. This applies to vertical axes and takes a number as a percentage as its value, with small values resulting in the axis title being closer to the axis and large values moving the title further from the axissee the Metview Python Release Notes for version 1.7.0 to see the new animation control in Jupyter!
fixed issue where named area ‘Europe’ could not be used from the Geographical View icon
fixed issue where overlay by date was selected in the Geographical View
Geopoints:
internal refactoring, resulting in performance improvements for most operations - large test cases are between 2 and 4 times as fast as before
if an NCOLS-format geopoints contains a column called ‘elevation’, it is now considered a coordinate column rather than a value column; this means that a computation performed on such a geopoints will not act on the elevation column, and visualisation will ignore it. This benefits data from the STVL.
BUFR:
the BUFR Examiner now allows subset navigation from subset value list in info sidebar
in the BUFR Examiner, the flag table value bits are now shown correctly in the details sidebar
ODB:
fixes in odc to alleviate issue of accumulated file handles when opening multiple ODB files
Macro/Python:
added function
absolute_vorticity()to compute absolute vorticity from relative vorticity GRIB dataadded function random_vector(num) to return a vector of num random numbers between 0 and 1
Misc:
fixed issue where occasionally dragging and dropping icons into a Python script produced Macro code instead of Python code
fixed Qt issue when running on Big Sur version of macOS
do not show warning message on startup if xdpyinfo does not exist
cleanup of error/warning messages that still referred to GRIB_API rather than ecCodes
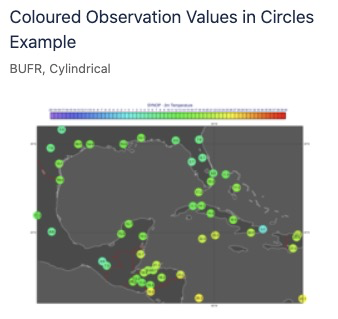
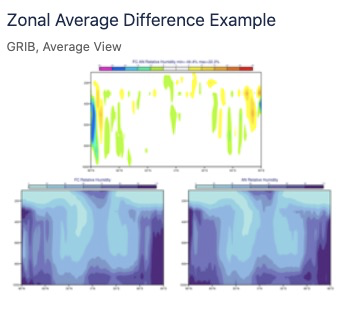
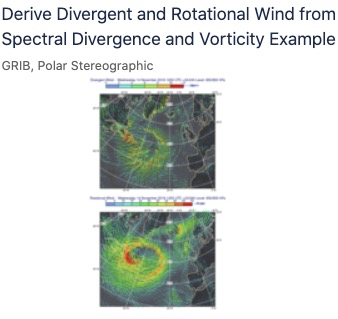
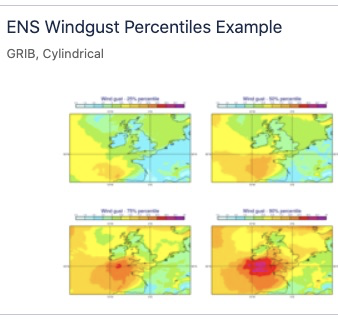
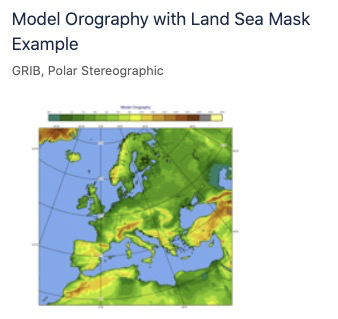
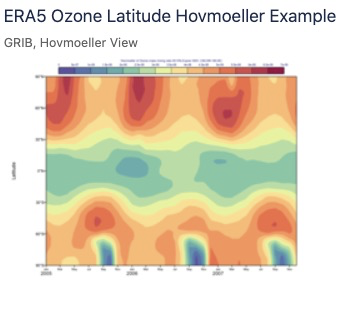
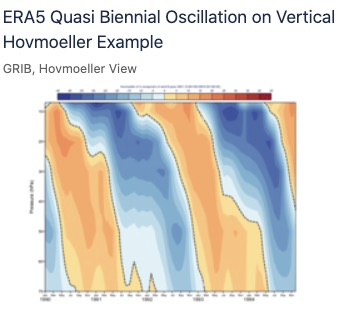
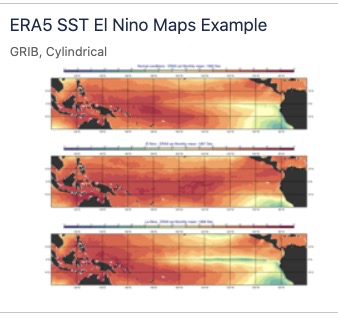
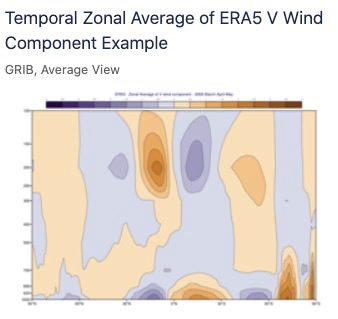
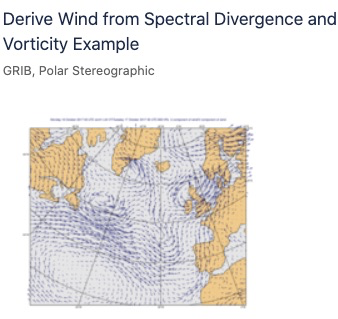
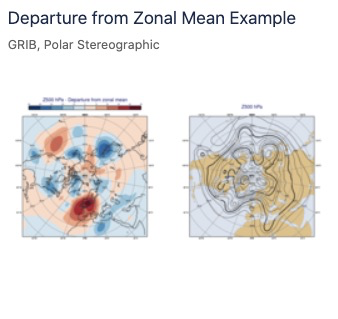
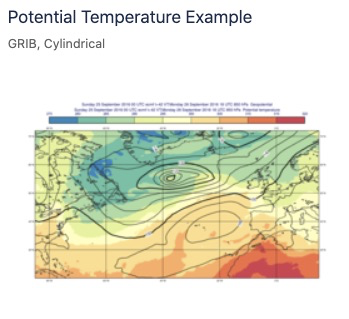
New Gallery Examples:
the following examples (Python only) were added to the Gallery: