Version 5.1 Updates
Version 5.1.1
Externally released https://confluence.ecmwf.int/display/METV/Releases 2018-07-31
Installed at ECMWF on 2018-07-24, became metview/new on 2018-07-31 (Linux desktops, ecgate, lxc, lxop)
At ECMWF:
Features:
Input Visualiser: fixed issue where nil values passed to the Input Visualiser were not properly treated
Geopoints to Grib: fixed issue where missing values were not properly generated when the geopoints data did not have sufficient coverage to compute every grid point value
FLEXPART: fixed issue where trajectory results could contain invalid characters due to wrong input data
Python: if a Metview function call fails, an error is now properly returned to Python
Python: fixed issue where Python could not connect to a Metview version that was installed through RPM (in particular, if its libraries are in lib64 rather than lib)
Build: fixed a compilation issue with Qt 5.11
Bundle: fixed issue with destination of binaries when installed after being built from a bundle
Version 5.1.0
Externally released on 2018-06-25
Became metview/new at ECMWF on 2018-06-25 (Linux desktops, ecgate, lxc, lxop)
Highlights
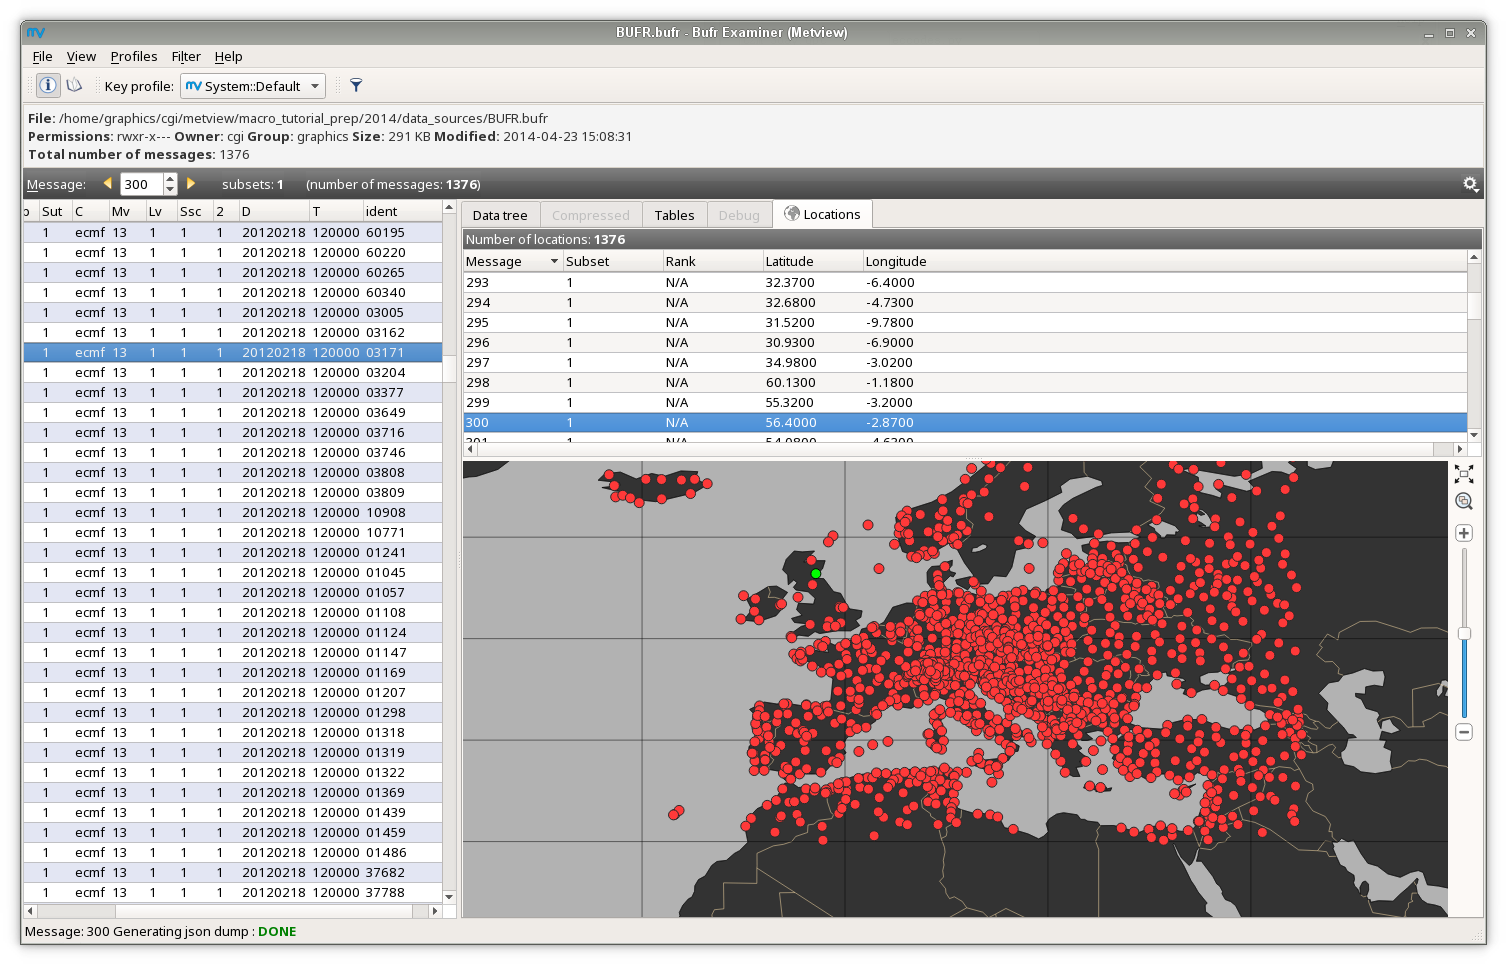
BUFR handling performed by ecCodes
Metview now uses ecCodes for all its handling of BUFR data. This includes the Observation Filter and BUFR Picker icons, and also the BUFR Examiner. We also link with Magics 3.1, which now uses ecCodes to plot BUFR data. The Data Coverage module has been removed - please let us know if you would like us to reinstate it. Observation Filter and BUFR Picker can now accept ecCodes keys, as well as descriptors, to specify parameters. The data examiners now share their code with CodesUI and have a different look and feel, including all the new BUFR inspection features.
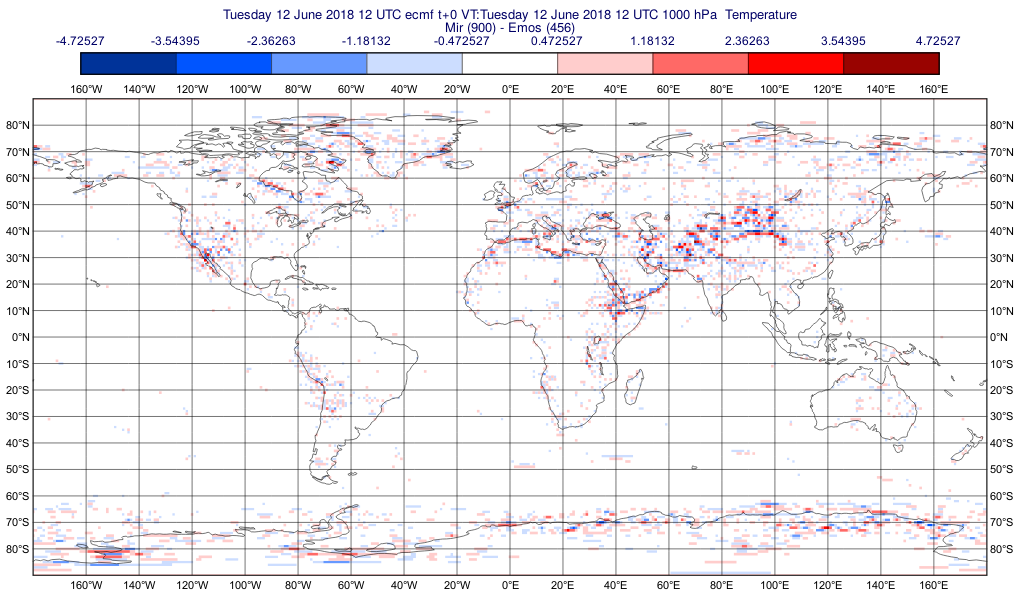
Additional modules using MIR as the interpolation package
Metview now has a set of new modules and functions that use MIR as the interpolation package. These are MARS Retrieval Mir, GRIB Filter Mir and DivRot Mir. The new Macro functions are:
retrieve_mir()
read_mir()
divrot_mir()
divwind_mir()
uvwind_mir()
Note that this feature will not be available outside ECMWF and ecgate until the official release of mir.
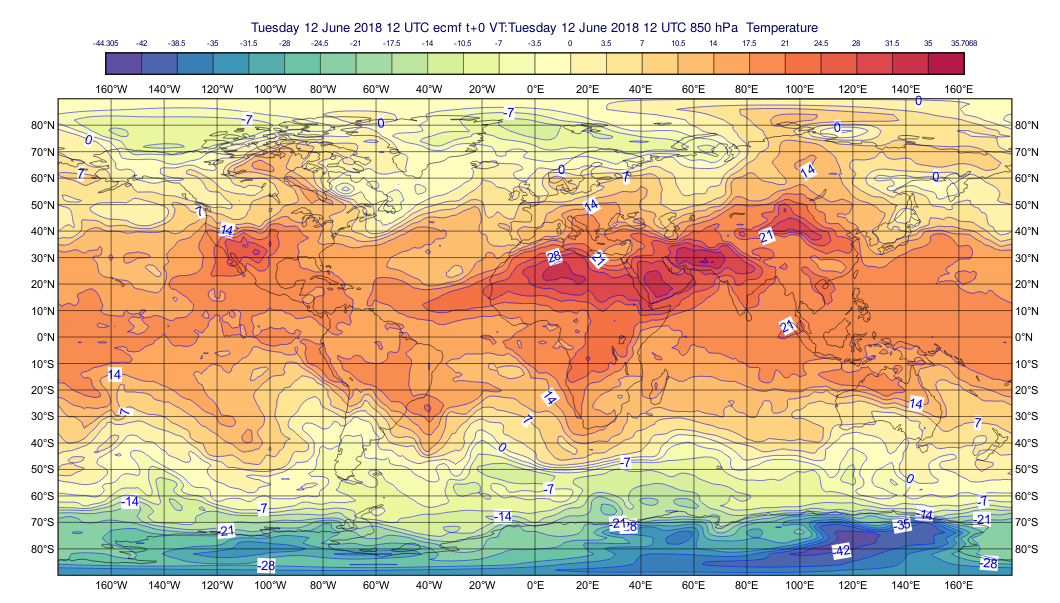
Example of using the new mir-based MARS routines to compare against libemos:
 # Metview Macro # **************************** LICENSE START *********************************** # # Copyright 2018 ECMWF. This software is distributed under the terms # of the Apache License version 2.0. In applying this license, ECMWF does not # waive the privileges and immunities granted to it by virtue of its status as # an Intergovernmental Organization or submit itself to any jurisdiction. # # ***************************** LICENSE END ************************************ req = (param:'t', levelist: 850, grid:[1,1]) emos = retrieve(req) mir = retrieve_mir(req) diff = mir - emos maxdiff = maxvalue(abs(diff)) levels = maxdiff * [-1, -0.75, -0.5, -0.25, -0.1, 0.1, 0.25, 0.5, 0.75, 1] diff_cont = mcont( legend : "on", contour : "off", contour_level_selection_type : "level_list", contour_level_list : levels, contour_shade : "on", contour_shade_technique : "grid_shading", contour_shade_colour_method : "palette", contour_shade_palette_name : "eccharts_blue_white_red_9" ) vi = version_info() title = mtext(text_line_count: 2, text_line_2 : "Mir (" & vi.mir_version & ") - Emos (" & vi.emos_version & ")") legend = mlegend(legend_text_font_size : 0.275) plot(diff, diff_cont, title, legend)
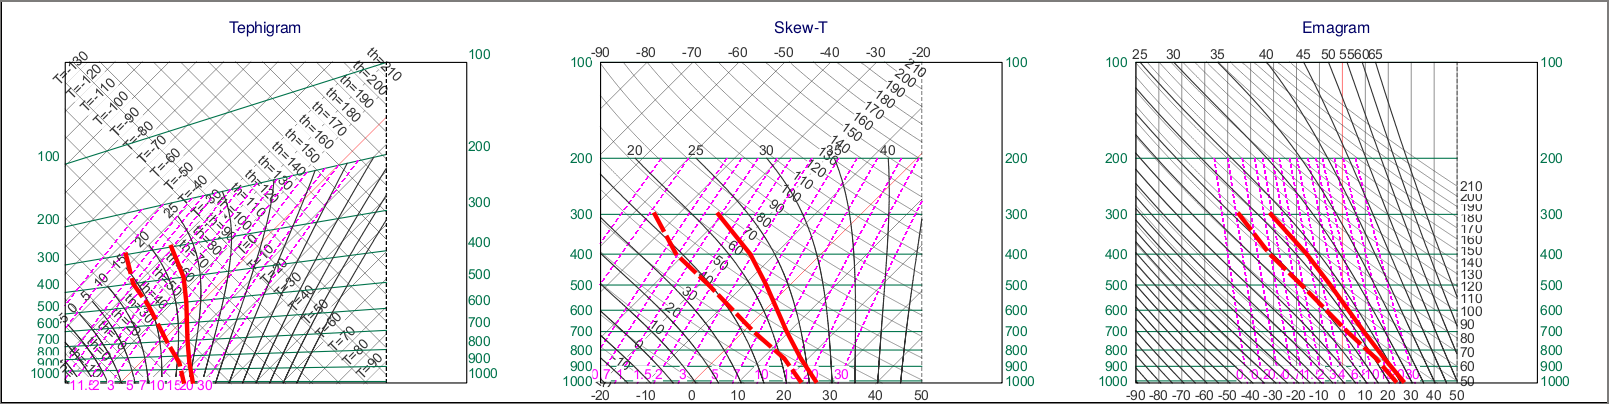
New thermodynamic diagram types
Metview has added new thermodynamic diagram types Skew-T and Emagram to the Thermo View icon. The following example shows how to plot all three.
 # Metview Macro # **************************** LICENSE START *********************************** # # Copyright 2018 ECMWF. This software is distributed under the terms # of the Apache License version 2.0. In applying this license, ECMWF does not # waive the privileges and immunities granted to it by virtue of its status as # an Intergovernmental Organization or submit itself to any jurisdiction. # # ***************************** LICENSE END ************************************ data_for_tephigram = retrieve( param : ["t","q"], grid : [1,1]) thermo_data = thermo_grib( coordinates : [49.63,21.12], data : data_for_tephigram) tephiview = thermoview(subpage_y_position : 5) page = plot_page( right : 33.33333, view : tephiview) skewtview = thermoview(type: "skewt",subpage_y_position : 5) page_1 = plot_page( left : 33.3333, right : 66.66667, view : skewtview) emagramview = thermoview(type : "emagram", subpage_y_position : 5) page_2 = plot_page( left : 66.66667, right : 100.0, view : emagramview) dw = plot_superpage( layout_size : "custom", custom_width : 40, custom_height : 10, pages : [page,page_1,page_2]) title_tephi = mtext(text_line_1: "Tephigram", text_font_size : 0.35) title_skewt = mtext(text_line_1: "Skew-T", text_font_size : 0.35) title_emagr = mtext(text_line_1: "Emagram", text_font_size : 0.35) plot(dw[1], thermo_data, title_tephi) plot(dw[2], thermo_data, title_skewt) plot(dw[3], thermo_data, title_emagr)
Access to pre-defined palettes in Magics
Added the set of predefined palettes available in Magics - see the example below, also see Predefined palettes in Magics for the list of available palettes.
 # Metview Macro # **************************** LICENSE START *********************************** # # Copyright 2018 ECMWF. This software is distributed under the terms # of the Apache License version 2.0. In applying this license, ECMWF does not # waive the privileges and immunities granted to it by virtue of its status as # an Intergovernmental Organization or submit itself to any jurisdiction. # # ***************************** LICENSE END ************************************ t = retrieve( levelist : 850, param : "t", grid : [2,2] ) pal4 = mcont( legend : "on", contour_highlight : "off", contour_level_count : 25, contour_shade : "on", contour_shade_colour_method : "palette", contour_shade_method : "area_fill", contour_shade_palette_name : "eccharts_rainbow_purple_red_25" )
Other features of Metview 5.1
Geopoints:
added new Macro data type, Geopointset, a container for multiple geopoints variables
added the ability to store and query arbitrary meta-data in a Geopoints file/variable
added the ability to filter a geopointset based on the meta-data of its constituent geopoints, e.g.
gfilt = filter(gptset, (level:500, step:[6, 12, 18]))
Data examiners:
Metview’s data examiners now share their code with CodesUI and have a different look and feel
fixed occasional crash in the data examiner applications
Met.3D
Metview’s support for the Met.3D application for 3D visualisation of meteorological fields continues with a new module for retrieving and pre-processing data suitable for ingestion by Met.3D. See Met3D Prepare.
GRIB Filter:
fixed issue where consecutive runs of GRIB Filter (read() command in Macro) did not work on the previously filtered data, but on the original data
Thermo:
changes in Magics 3.1 mean that in order to place a wind flag in the centre of the right-hand portion of the plot, an x value of 1025 is now required; previously it was 1000.5
fixed issue where dropping a Thermo View into an existing plot window did not always work
fixed issue where a Thermo View could not be dropped into the Display Window editor for creating a layout
Macro:
added support for 32-bit floating point vector variables; the default is 64-bit, but can be changed by calling either vector_set_default_type(‘float32’)or vector_set_default_type(‘float64’). From then on, all newly created or computed vector variables with be of the specified size. The data size of a vector variable can be queried using the function dtype(vector).
vector variables can now be written to disk with the write() command and read back with the read() command
new function to return a list of the names of the columns in an odb variable - columns(odb)
fixed issue with the interpolate() function returning wrong values when the input field is Gaussian (regular or reduced)
fixed issue there the remove_duplicates(geopoints) function did not remove all duplicates in the case where there are are multiple points sharing the same location, AND there are multiple values at that location, some of which are the same, some of which are different
Plotting:
Added parameter Obs Level to the Observation Plotting icon to plot only those observations on a particular level
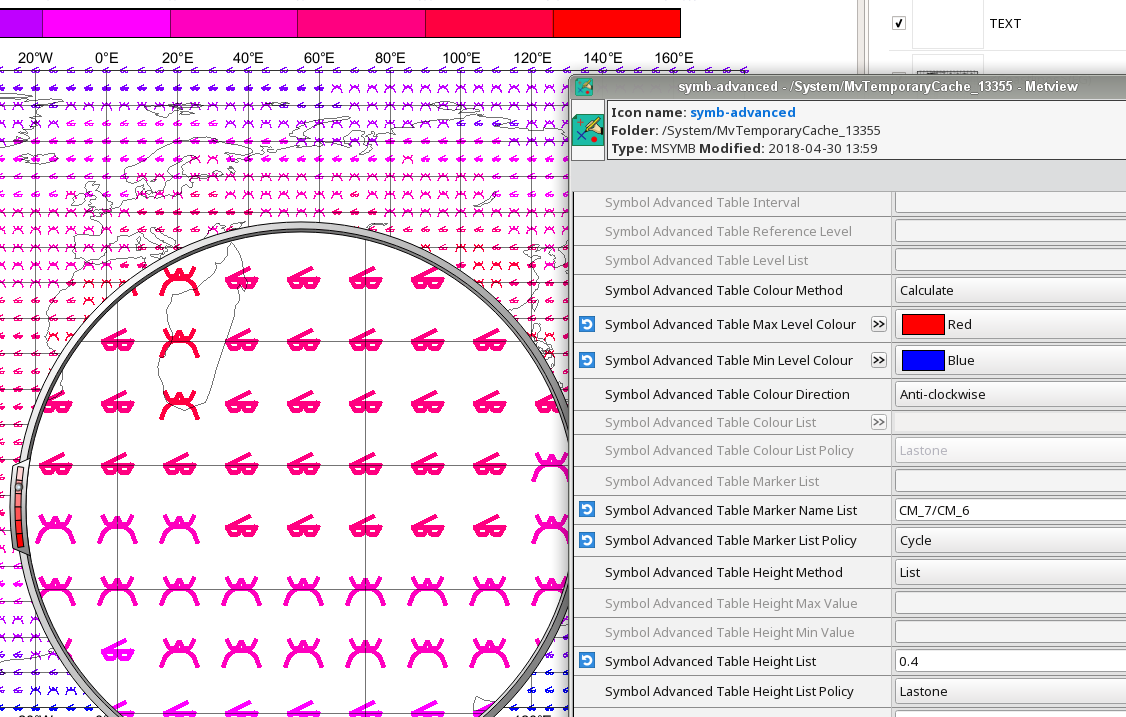
Added parameter Symbol Advanced Table Marker Name List to the Symbol Plotting icon. See example below.
Added parameter Legend Values List to the Legend icon for customising which values get a legend entry
The Geographic View can now accept sub-areas as N/W/S/E as well as what it previously understood, S/W/N/E
Small revisions to the list of countries for which administrative boundaries can be plotted in the Coastlines icon
Fixed issue where the automatically generated Macro code from a plot could give wrong code if both scalar and vector fields are present
Fixed issue when generating a Macro from a plot that was itself generated from a Macro - a binary file was generated instead of a Macro file
Hovemoeller:
The Hovmoeller module now allows input data containing multiple experiments
User Interface:
fixed issue on Mac OSX where it was not possible to create a new Metview icon
Documentation:
updated the Gallery to combine Macro and Python scripts into one place, and to include a tarball including the data required for each example
Build:
as a result of using ecCodes for BUFR handling, Metview can no longer be linked with GRIB_API
as a result of the new data examiner code, Metview requires at least Qt 5 in order to build its user interface
Metview now requires a C++11 compliant compiler
fixed some building issues on Mac OSX
fixed issue where cpack could not produce a working RPM from the Metview Bundle
Example of the new symbol plotting parameter