Version 5.16 Updates
Version 5.16.0
Externally released on 2022-05-18
Became metview/new at ECMWF on 2022-05-18 (Linux desktops, ecgate, lxc, lxop)
At ECMWF:
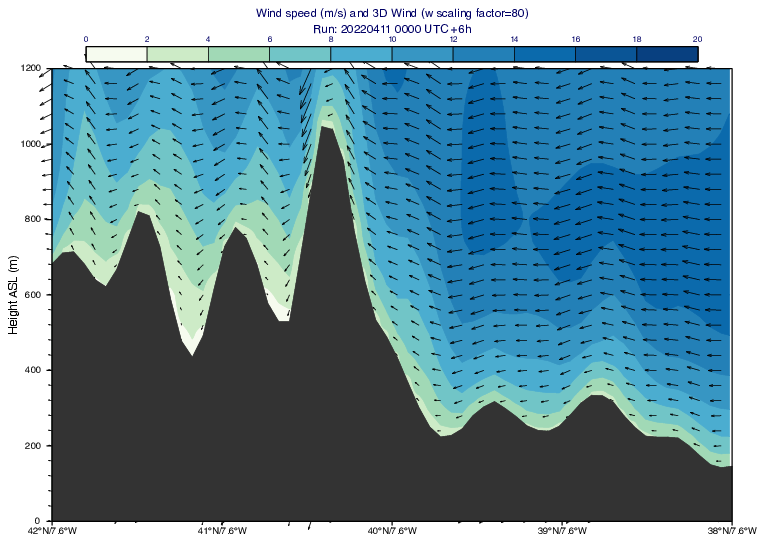
Cross Section
Improved data sampling near orography when using model level data and height vertical axis in Cross Section Data and Cross Section View. Implemented by the following changes:
The “count” and “level_list” options for the
level_selectionparameter were made available for user defined vertical coordinates too (whenvertical_coordinatesis “user”)Added new parameter
vertical_coordinate_extrapolate_mode: controls the extrapolation at the top and bottom of the coordinate range for user defined vertical coordinates (whenvertical_coordinateis “user”). The possible options are “constant” and “linear”.Added new parameter
vertical_coordinate_extrapolate_fixed_sign: for the “linear” extrapolation mode it controls whether the extrapolated values can differ in sign from the values on the nearest input levels. When it is “on” it prevents e.g. wind components to change sign due to extrapolation.Fixed issue when 3D wind way displayed at incorrect levels when using model level data and height vertical axis.
See the new gallery examples (example1 and example2) showcasing some of these options:
In wind mode it is now mandatory to have the same number of input levels for all the required wind components
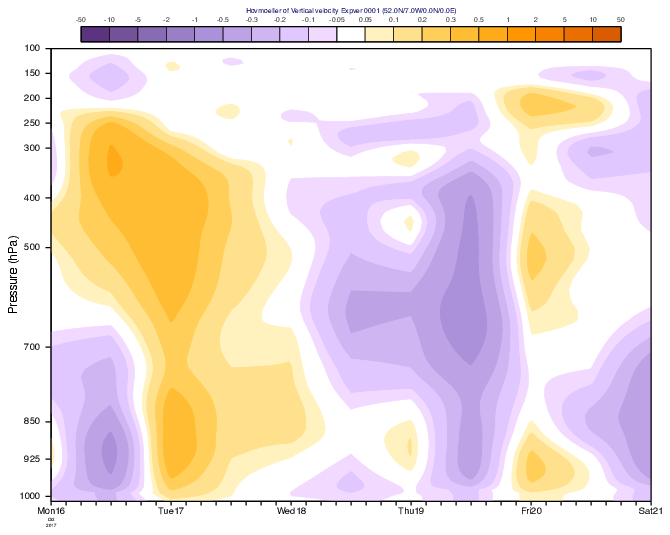
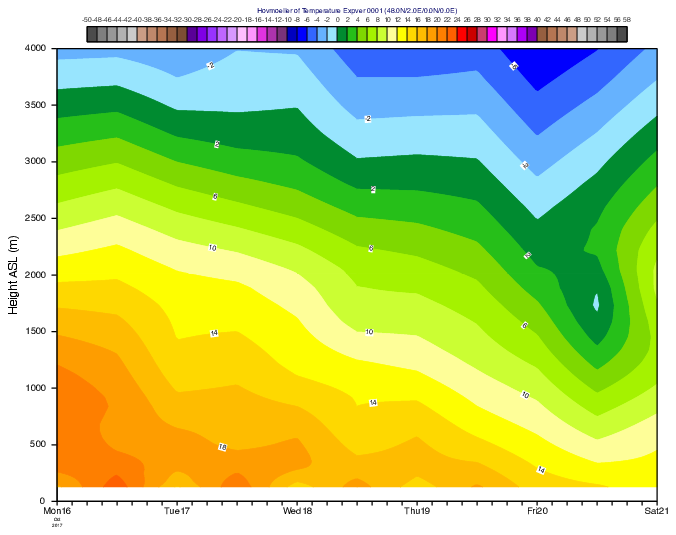
Vertical Hovmoeller
Several improvements were made to the vertical Hovmoeller diagrams in
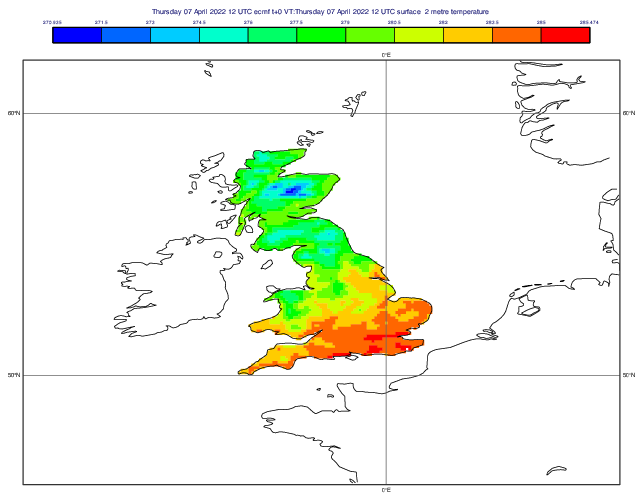
mhovmoeller_vertical()andmhovmoellerview():To display model level input with pressure vertical axis the input now must contain an LNSP (Logarithm of Surface Pressure) field. Previously it was not required but a fixed surface pressure value was used instead (internally), which led to incorrectly computed pressure levels.
Added new parameter
input_modeto control how the input data is extracted. The possible values are “area”, “point” and “nearest_gridpoint”. To specify the location for “point” or “nearest_gridpoint” thepointparameter was added.Added a new mode “user” to
vertical_level_typeto enable the usage of arbitrary vertical coordinate fields. These fields are identified by the ecCodes paramId specified invertical_coordinate_param.Added new parameter
vertical_coordinate_extrapolateto control the extrapolation at the top and bottom whenvertical_level_typeis “user”.Added new parameter
vertical_coordinate_extrapolate_modeto control the extrapolation. The possible options are “constant” and “linear”.Added new parameter
vertical_coordinate_extrapolate_fixed_sign: for the “linear” extrapolation mode it controls whether the extrapolated values can differ in sign from the values on the nearest input levels. When it is “on” it prevents e.g. wind components to change sign due to extrapolation.
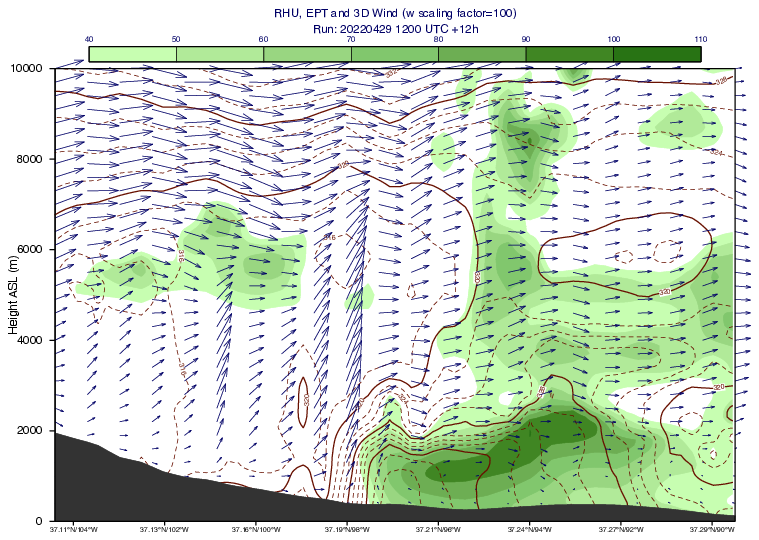
See the new gallery examples for displaying model levels with pressure axis and model levels with height axis:
Macro/Python
Added new function
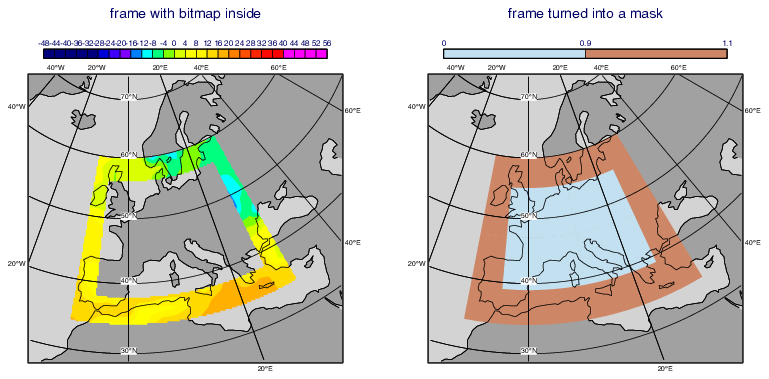
poly_mask()to mask GRIB fields using arbitrary polygons. See the new gallery examples with polygons defined by user points and extracted from a shapefile: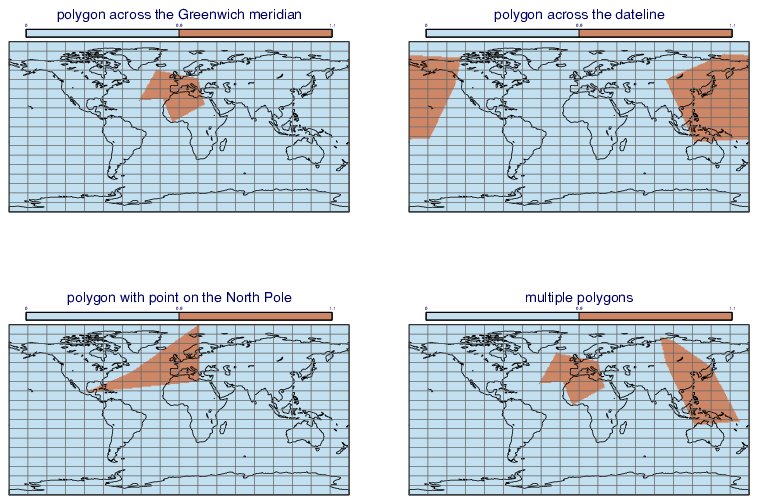
mean()andsum()now have an option calledmissingto control how to handle missing values during the computations. By defaultmissingis False, which means that if at a gridpoint there is a missing value in any of the input fields the output will contain a missing value at that gridpoint. However, whenmissingis True all the non-missing values are used to form the mean/sum at a given gridpoint. See the gallery example: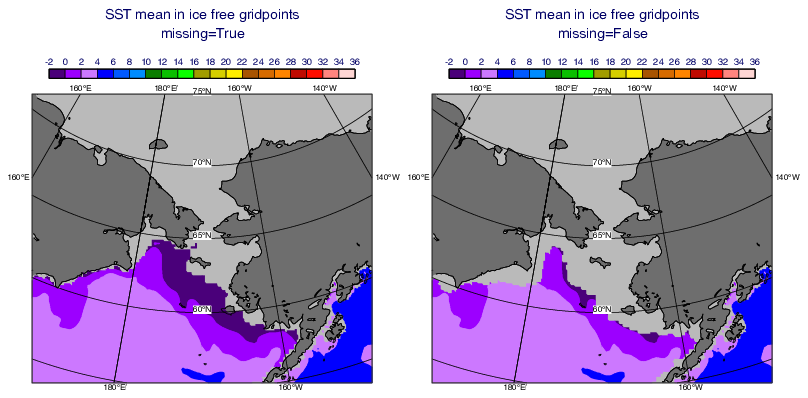
mvl_ml2hPa(),ml_to_hl(),mvl_geopotential_on_ml(): these functions were re-implemented to improve performance by using less GRIB encoding-decoding and storing intermediate results in memory. The speed-up is quite significant: it is about x20 formvl_ml2hPa(), x6 forml_to_hl()and x3 formvl_geopotential_on_ml(). This was achieved by only a 30% increase in memory usage formvl_ml2hPa(), while the other two functions now use significantly less memory.mvl_ml2hPa(): fixed issue when incorrect results were produced when called from Pythonmvl_geopotential_on_ml(): fixed issue when crashed during reporting certain errorsNetCDF variables with uint values are now supported
NetCDF variables with int64 attributes are now supported
fixed issue where two newly-created NCOLS-formatted geopoints could not be merged after one had been written to disk
UI/uPlot
Added new projection ‘EPSG:3035’ to
geoview(), see the gallery example: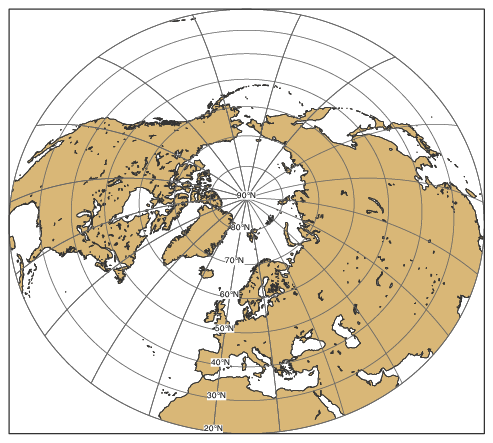
Added new Preferences option called
Default Folder For File Dialogsto control what folder the Save/Export dialogs show when they are opened up. The possible values are “current” and “previous”.Fixed issue when the Metview interface exited with error code 1 on normal exit
Miscellaneous
the environment variable ECCODES_DEBUG is now preserved when running at ECMWF
if RPC libraries are not found when building Metview, the build will stop at CMake time with a relevant error message
New Gallery Examples