Version 5.9 Updates
Version 5.9.1
Externally released on 2020-07-22
Became metview/new at ECMWF on 2020-07-22 (Linux desktops, ecgate, lxc, lxop)
At ECMWF:
BUFR Filtering:
fixed issue where geopoints were sometimes generated with a mixture of spaces and tabs; now in these cases, only tabs are used
MARS access:
fixed issue where fdb5 was not being directly accessed when Metview is built at ECMWF
Meteogram:
fixed issue where the Meteogram module could crash if given a large number of stations (> 20 or so)
Plotting:
fixed issue in the Geographical View icon where some of the pre-defined areas in polar stereographic projection were not correctly plotted
ecCharts:
the ECCHARTS module is now built by default; previously it was only built if the UI was built
Tests:
fixed a geopoints test that was failing with clang compilers
Version 5.9.0
Externally released on 2020-06-24
Became metview/new at ECMWF on 2020-06-24 (Linux desktops, ecgate, lxc, lxop)
At ECMWF:
Plotting:
support for more grids, with the latest versions of ecCodes (2.18.0) and Magics (4.4.0):
Mercator grid supported for processing and plotting, including Cursor Data
Lambert Azimuthal Equal Area grid, including on oblate spheroid, supported for plotting
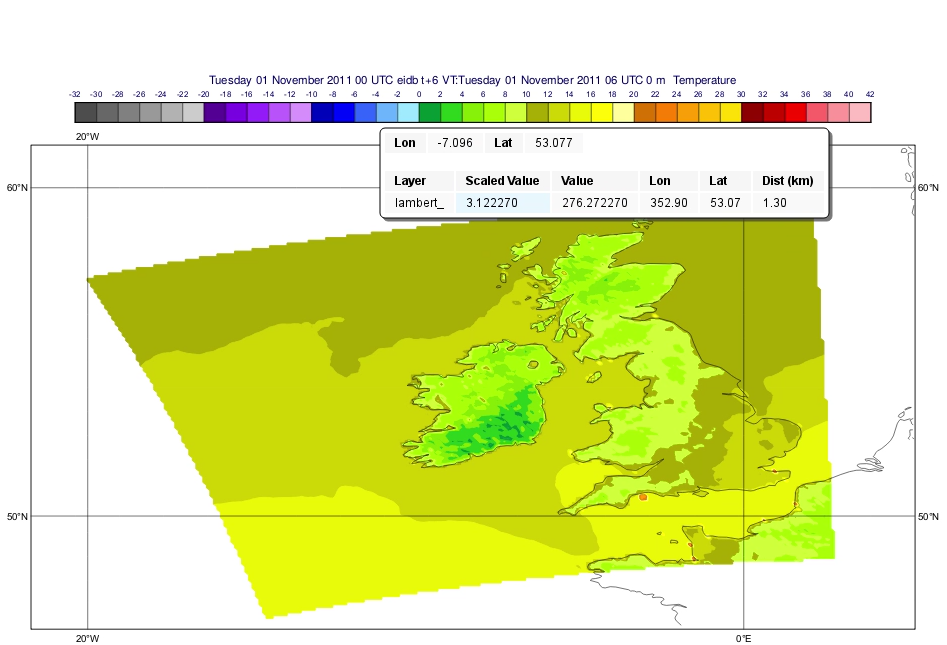
Lambert Conformal grid supported for processing and plotting, including Cursor Data
Polar Stereographic grid supported for plotting, including Cursor Data
Input Visualiser now accepts vectors (Macro langauge) and numpy arrays (Python) for the following parameters: input_x_values, input_y_values, input_x2_values, input_y2_values, input_longitude_values, input_latitude_values, input_values. For arrays with more than 10,000 or so entries, this can provide a speed up of hundreds of times compared to using lists. Example plot using the Binning options of the Input Visualiser:
Improved step string in the title of a FLEXPART plot using the flexpart_build_title() function - for example, a step of 90 minutes will now be rendered as “1h 30m” in the title
BUFR:
fixed occasional crash in the Observation Filter when used with TEMP data
Fortran:
Metview’s two remaining Fortran-based modules, Potential Temperature and Spectra, have now been re-written in C++, meaning that a Fortran environment is no longer required in order to use them. These modules were disabled in Metview’s conda builds in order to avoid the need for Fortran; from this release onwards, they will be available in the conda versions
Macro/Python:
function direction() now handles missing values properly - see Fieldset Functions
function univertint() now supports pressure levels as input
added function filetype() to return the internal Metview type of a given file
Macro-based user interfaces can now use the help_script parameter for any input type
macOS:
fixed issue seen on macOS where the area selection tool in the Geographical View icon editor could cause a crash
fixed issue seen on macOS where using the Cross Section View and related icons multiple times could cause instability
Gallery:
added new examples for ensemble data handling:
added new example using the Spectra module: