Version 4.7 Updates
Version 4.7.2
Externally released on 2016-10-20
Became metview/new at ECMWF on 2016-10-20 (Linux desktops, ecgate, lxc)
At ECMWF:
GRIB: fixed issues when interpreting the base/valid dates of hindcast data - now the hindcast date is always used; the following aspects have been modified to use it:
Cross Section, Average, Vertical Profile, Hovmoeller, the frame list and meta-data in the Display Window, the default key profile in the Grib Examiner, the Macro functions base_date() and valid_date().
(note: a pending fix in Magics is still required to produce the correct plot title)
Plotting: fixed issue where occasionally a plot exported from the plot window did not produce a file (if the plot was generated from data specified via relative paths)
Average View: fixed issue where the area selection helper tool did not show the map
Geographical View: fixed issue where the projections defined by EPSG codes did not work (requires Magics 2.29.6)
Macro: added bounds-checking when indexing a geopoints variable
Coastlines: the list of countries available for plotting administrative boundaries is now sorted alphabetically
User Interface: optimised recognition of PDF, PNG and PS files by their file extensions
User Interface: improved display of file sizes when the mouse cursor hovers over an icon
Grib Examiner: improved display of file sizes in the Info panel
Version 4.7.1
Became metview/new at ECMWF on 2016-08-22 (Linux desktops, ecgate, lxc):
This version contains no changes to Metview itself - the only
difference is that it is linked with GRIB_API 1.17.0 and emoslib 4.4.3.
At ECMWF:
Installed as metview/new
Built with Magics 2.29.3. See the Magics Latest News.
Built with GRIB_API 1.17.0
Built with ODB_API version 0.11.4
Built with emoslib 000443. See the Change History.
Version 4.7.0
Externally released on 2016-07-19
Became metview/new at ECMWF on 2016-07-19 (Linux desktops, ecgate, lxc)
At ECMWF:
Installed as metview/new
Built with Magics 2.29.3. See the Magics Latest News.
Built with GRIB_API 1.16.0
Built with ODB_API version 0.11.4
Built with emoslib 000442. See the Change History.
New module: the Download from URL module allows an arbitrary URL to be given as input, and Metview will download and cache the given file, writing to a local directory if directed to do so
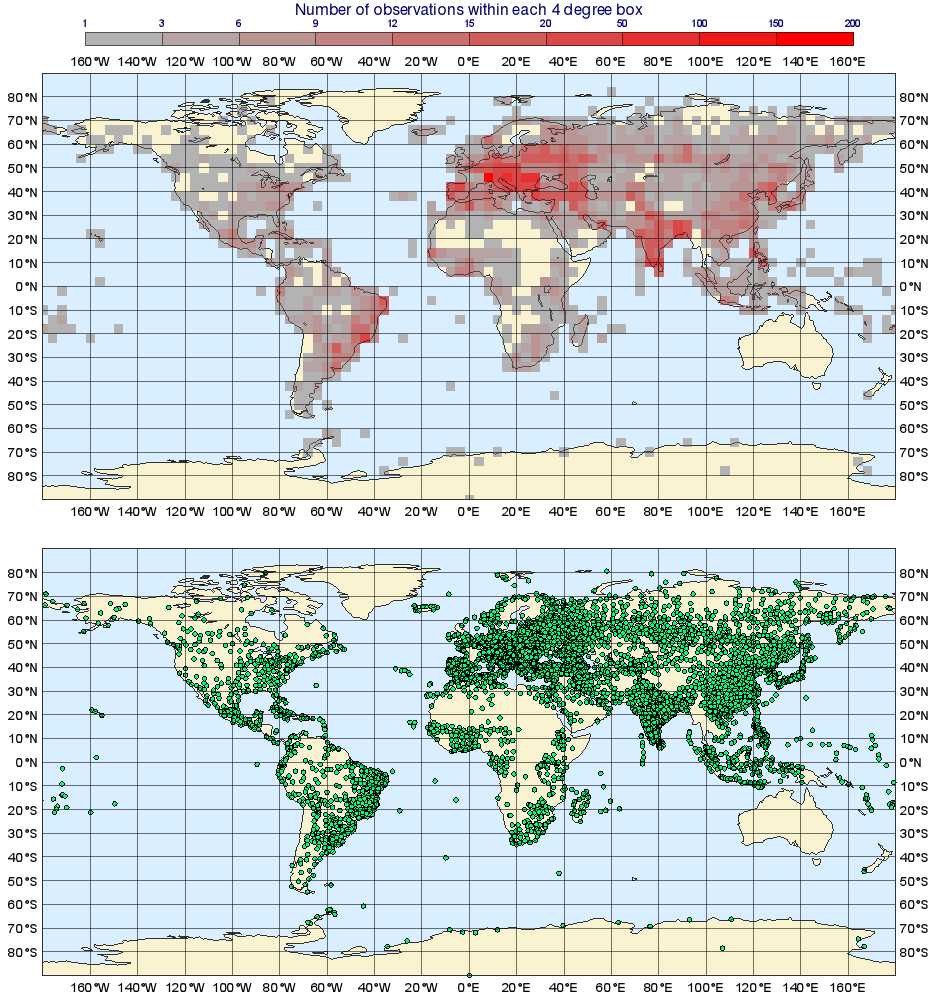
Geopoints to GRIB: three new modes available: Nearest Gridpoint Mean, Nearest Gridpoint Sum and Nearest Gridpoint Count. See Geopoints To Grib for more information. Also see the example below.
Macro: added two new fieldset Macro functions to extract date and time information from GRIB data:
date or list base_date ( fieldset )
Returns the base dates (including the time components) of the given fields. If the fieldset has only one field, a date is returned; otherwise a list of dates is returned.
date or list valid_date ( fieldset )
Returns the valid dates (including the time components) of the given fields. If the fieldset has only one field, a date is returned; otherwise a list of dates is returned.
Macro editor: improved the behaviour of the search/replace dialogue so that it is possible to verify each replace operation before performing it
Stations: updated the stations database to use the latest list from WMO
SCM: fixed issue where Metview allowed the editing of SCM output files, but used the Macro Editor to do so; in fact, these files should not be editable at all, and this action has now been disallowed
Build: fixed issue where the layoutx3.mv test could take a very long time if the user had certain default Contouring settings
Documentation: added a gallery of plots from the OpenIFS workshop from May 2016
Example of Nearest Gridpoint Count mode of the Geopoints to GRIB module
# Metview macro

#  **************************** license start ***********************************
#
#  copyright 2016 ecmwf. this software is distributed under the terms
#  of the apache license version 2.0. in applying this license, ecmwf does not
#  waive the privileges and immunities granted to it by virtue of its status as
#  an intergovernmental organization or submit itself to any jurisdiction.
#
#  ***************************** license end ************************************


# retrieve some observation data and conver it to geopoints format
data1 = retrieve(
   type   : "ob",
   repres : "bu",
   date   : 20150715
   )

obs_wmo_block = obsfilter(
   output    : "geopoints",
   parameter : 01001,
   data      : data1
   )

# convert the geopoints to GRIB, counting the number of points in each 4-degree cell
obs_heat_map = geo_to_grib(
   grid                 : [ 4,4 ],
   interpolation_method : "nearest_gridpoint_count",
   geopoints            : obs_wmo_block
   )

# plotting attributes
heat_map_shade = mcont(
   legend                         : "on",
   contour                        : "off",
   contour_level_selection_type   : "level_list",
   contour_min_level              : 1,
   contour_level_list             : [ 1,3,6,9,12,15,20,50,100,150,200 ],
   contour_shade                  : "on",
   contour_shade_technique        : "grid_shading",
   contour_shade_max_level_colour : "red",
   contour_shade_min_level_colour : "grey",
   contour_shade_colour_direction : "clockwise"
   )

title = mtext(
   text_line_1 : "number of observations within each <grib_info key='jDirectionIncrementInDegrees'/> degree box"
   )

symb_advanced_mono = msymb(
   symbol_type         : "marker",
   symbol_outline      : "on",
   symbol_colour       : "bluish_green",
   symbol_marker_index : 15
   )


# call function to build layout (defined at end of macro)
dw = build_layout()

# plot commands
plot ( dw[1], title, obs_heat_map, heat_map_shade )
plot ( dw[2], obs_wmo_block, symb_advanced_mono )

# end of main program

# function to build the layout
function build_layout()

   #pagedescription

   land_sea_shade = mcoast(
      map_coastline_land_shade        : "on",
      map_coastline_land_shade_colour : "rgb(0.98,0.95,0.82)",
      map_coastline_sea_shade         : "on",
      map_coastline_sea_shade_colour  : "rgb(0.85,0.93,1)"
      )

   geographical_view = geoview(
      coastlines    : land_sea_shade
      )

   page = plot_page(
      top     : 2.58317033154,
      bottom  : 52.5831715633,
      left    : 0,
      right   : 100,
      view    : geographical_view
   )

   coastlines = mcoast(
      map_coastline_land_shade        : "on",
      map_coastline_land_shade_colour : "rgb(0.98,0.95,0.82)",
      map_coastline_sea_shade         : "on",
      map_coastline_sea_shade_colour  : "rgb(0.85,0.93,1)",
      map_label_top                   : "off"
      )

   gv_obs = geoview(
      coastlines    : coastlines
      )

   page_1 = plot_page(
      top     : 50,
      bottom  : 100,
      left    : 0,
      right   : 100,
      view    : gv_obs
   )

   # superpage description
   display_window = plot_superpage(
      layout_size        : "a4",
      layout_orientation : "landscape",
      custom_width       : 29.7,
      custom_height      : 21.0,
      pages              : [ page, page_1 ]
   )
   # plot_superpage returns a list of drop identifiers.
   # index 1 is for first page, and so on.

   return display_window

end build_layout