Version 4.6 Updates
Version 4.6.7
Externally released on 2016-06-29
Became metview/new at ECMWF on 2016-07-12 (Linux desktops, ecgate, lxc)
At ECMWF:
Installed as metview/new
Built with Magics 2.29.2. See the Magics Latest News.
Built with GRIB_API 1.16.0
Built with ODB_API version 0.12.0
Built with emoslib 000442. See the Change History.
GRIB: fixed an issue when interpreting GRIB fields which are stored in Lambert projection - Metview’s own internal routines can now handle the case where jScansPositively=0. Note that this does not affect the direct plotting of these fields, but will take effect when using other Metview functionality such as converting such fields to the Geopoints format, computing cross sections, and also when using the Macro functions nearest_point() and interpolate().
Plotting: a fix in Magics allows Metview to once again plot GRIB fields in Space View projection; this functionality had been lost in Metview 4.6.6.
Plotting: fixed a small bug in the plotting module which could have caused undefined behaviour (e.g. a crash) and a random name to appear in Metview’s Process Monitor
Plotting: fixed an issue where particular locale settings on the workstation could disrupt the plotting of certain fields. This had been seen in MSLP fields, where incorrect scaling resulted in far too many isolines being plotted
Observation Filter: this can now return a CSV file as output for multiple parameters (this feature has been available for some time, but the output data was not available to the user interface). The ability to save these files from a macro is still to be implemented though.
FLEXTRA: the Flextra Run icon now works when relative paths are supplied
FLEXTRA: the text direction in the icons’ images has been fixed
User Interface: fixed issue where missing icon files in the Metview installation could cause the user interface to hang
Build: this version of Metview can be built with ecCodes instead of GRIB_API. To do this, supply CMake with the command-line option -DENABLE_ECCODES=ON
Build: QtSvg is now a requirement when building Metview’s user interface (it was always needed, but its absence will now be caught at build time)
Build: enabled compilation with GCC 6.1
Documentation: updated the Using the MARS Web API from Metview page
Documentation: updated the the Metview source bundle installation guide
Default Version at ECMWF upgraded to 4.6.6
Upgrade 2016-06-15 (Linux desktops, lxa cluster, ecgate)
Version 4.6.6 became the default version (command metview) at ECMWF
To use another version, please use the modules system:
module avail metview
module switch metview/x.x.x
Test Version 4.6.6
Externally released on 2016-05-10
Became metview/new at ECMWF on 2016-05-10** (Linux desktops, ecgate, lxc)
At ECMWF:
Installed as metview/new
Built with Magics 2.29.0. See the Magics Latest News.
Built with GRIB_API 1.15.0
Built with ODB_API version 0.11.4
Built with emoslib 000441. See the Change History.
Plotting: Metview now allows for the plotting of geographic areas smaller than 0.1 degrees N/S and E/W
BUFR: added support for satellite prepBUFR data from NCEP so that it can be filtered via the Observation Filter and the Bufr Picker. Metview already supported other prepBUFR formats, but this one was slightly different.
Macro: fixed issue when interpreting input from a generated user interface - strings, such as file paths, which contain forward slashes were interpreted as lists. This is still the default behaviour, but if exclusive: “true” is set as part of the definition then the result will be interpreted as a string (“exclusive” meaning that there will only be one result and not a list of results)
WMS: fixed issue where the default proxy settings prevented the use of ecCharts WMS layers from Metview’s WMS Client icon when running at ECMWF
ODB: added the version of ODB_API to the following places:
the Macro function version_info()
the ODB Examiner’s ‘About’ help box
the Display Window (uPlot)’s ‘About’ help box
GRIB: improved the automatic recognition of GRIB files, e.g. when they have some additional header information from GTS
Startup: fixed issue where scripts called by BASH_ENV could interfere with Metview’s running
Simple Formula: this icon can now return BUFR as a data type; only likely to be used for merging two BUFR files
Documentation: added new page describing some techniques on how to write more efficient macros
Build: fixed issue with building with CMake 3.5; fixed issue building RPMs on OpenSUSE LEAP 42.1
Version 4.6.5
Externally released on 2016-03-06
Became metview/new at ECMWF on 2016-03-06
At ECMWF:
Built with Magics 2.28.0. See the Magics Latest News.
Built with GRIB_API 1.14.6
Built with ODB_API version 0.10.5.4
Built with emoslib 000439. See the Change History.
Startup: a data file can now be visualised directly from the command line without having to start Metview’s whole user interface
metview -p /path/to/file
works with GRIB, BUFR and geopoints files
when plotting GRIB, it uses the ecCharts library of styles where applicable
Tephigram: fixed issue in dewpoint computation from GRIB data using Saturation Over Water (values will be different) ; added new option Saturation Over Ice
Plotting: vector quantities such as U/V can now be plotted even if they appear in the GRIB file in the ‘reverse’ order, e.g. V/U instead of U/V.
Plotting: the layers meta-data panel now indicates whether the displayed reduced Gaussian grid is octahedral
Plotting: uses Magics’ updated coastlines database, which eliminates the stray lines we occasionally saw when zoomed into certain areas. For more details on Magics changes, please see here.
Plotting: automatic macro code generation has been improved for the following views: Hovmoeller View, Thermo View, Cross Section View, Average View, Vertical Profile View and their associated Data icons
Plotting: new Magics colour “ECMWF_blue” is now available
Plotting: added meta-data tag to selected output formats to indicate the version of Metview used to generate the plots
Meteograms: Metview now uses the new web service to retrieve meteograms. Small changes from the previous version may be observed.
a new meteogram, Plumes, is now available from the icon.
only PDF and PNG output are supported - the default output format is now PDF; jobs which assume PostScript output will need to be updated
the ‘classic’ metgram option (10_days_metgram) is no longer supported; users are advised to use Weather Parameter files to obtain a similar product
Observation Filter: updated the list of subtypes to include the following:
LSD - Bufr land synop, LSD - Bufr land synop 2, LSD - Bufr land synop Wmo region 6, LSD - Bufr land synop 1 hourly, SSD - Bufr ship synop
Stations: updated the list of WMO stations used by the Stations module
Environment: changed all of Metview’s internal scripts from ksh to bash. This removes Metview’s dependency on ksh
Examples: revised the icons and data in the Getting Started examples folder. Now includes some octahedral data, an ecCharts contouring icon and the MARS examples have been revised
Build: fixed issue where the batch-only version of Metview did not build (CMake option -DENABLE_UI=OFF). This also requires Magics 2.27.
Build: fixed issue where, in a parallel build, rpcmars.h was not built early enough and the build failed
Mac: fixed issue on the Mac where spurious files were seen in some directories
Default Version at ECMWF upgraded to 4.6.4
Upgrade 2016-02-09 (Linux desktops, lx* clusters, ecgate)
Version 4.6.4 became the default version (command metview) at ECMWF
To use another version, please use the modules system:
module avail metview
module switch metview/x.x.x
Version 4.6.4
Became metview/new at ECMWF on 2016-02-01
At ECMWF:
Built with Magics 2.26.1. See the Magics Latest News.
Built with GRIB_API 1.14.5
Built with ODB_API version 0.10.5.3
Built with emoslib 000437. See the Change History.
Version 4.6.3
Became metview/new at ECMWF on 2016-01-26
At ECMWF:
Built with Magics 2.26.1. See the Magics Latest News.
Built with GRIB_API 1.14.5
Built with ODB_API version 0.10.5.3
Built with emoslib 000436. See the Change History. Note that this version of emoslib offers some improved performance and accuracy - see Emoslib Releases.
Version 4.6.1
Externally released 2015-12-02
Became metview/new at ECMWF on 2015-12-09
At ECMWF:
Built with Magics 2.26.1. See the Magics Latest News.
Built with GRIB_API 1.14.4
Built with ODB_API version 0.10.5.3
Built with emoslib 000433. See the Change History. Note that this version of emoslib offers some improved performance and accuracy - see Emoslib Releases.
Grib To Geopoints: this module has a new mode which allows the user to create an output GRIB on any grid, simply by supplying a template GRIB file from which the grid of the output data will be derived.
Macro: new function, fill_missing_values_ew(fieldset). Currently, only implemented for regular lat/long grid format, this function can be useful for filling missing values with ‘real’ values in order to improve plotting quality.
For each latitude line, analyses each point along the row. If a point is a missing value then replaces it by the following:
if the next point is a non-missing value then take that value; otherwise, take the previous non-missing value.
Macro: added Metview revision number (member “metview_revision”) to function version_info().
Average View: fixed issue where it was not possible to plot the result of an Average Data computation inside an Average View (also with Cross Section)
Version 4.6.0
Externally released 2015-11-19
MARS: updated the MARS client and dependent libraries to versions which support octahedral grids. See also Detailed information of implementation of IFS cycle 41r2 for information on how to structure MARS requests for reduced Gaussian grids (including octahedral grids).
Plotting: re-introduced the Streamlines plotting parameters in the Wind Plotting icon, using the new streamlines plotting functionality in Magics. See example below.
Plotting: added new parameters to the Contouring icon for allowing WMO symbols to be used in marker shading: Contour Shade Marker Table Type (Index / Name) and Contour Shade Marker Name Table.
Plotting: fixed issue where the macro automatically generated from a plot did not honour the current geographical co-ordinates of the plot.
Plotting: fixed an issue where a small area was not filled with shaded contours.
Plotting: added a new parameter, Subpage Clipping (On / Off) to the View icons, primarily to allow the clipping of wind arrows/flags to the subpage. See the streamlines example below.
Plotting: added new parameters to the Contouring icon to control the interpolation of reduced Gaussian grids: Grib Interpolation Method (Interpolate / Nearest / Nearest Valid) and Grib Interpolation Method Missing Fill Count (only valid in mode Nearest Valid).
Plotting: the default Geographical View is now taken from the System/Defaults folder, in line with other icons.
Plotting: fixed an issue where sending a plot to a printer could result in part of the plot being clipped.
Plotting: fixed an issue where the automatically generated macro from a plot did not contain the legend specification.
Plotting: changed the default visdef used for plotting geopoints wind from Contouring to Wind Plotting.
Plotting: in the NetCDF Visualiser icon, changed the default missing value attribute to _FillValue in line with CF convention.
Plotting: fixed issue in the Plot Export dialogue where selecting an existing file could cause the plot to be immediately saved with that name rather than giving the user the opportunity to change the filename.
Macro: fixed issue where the nearest_gridpoint(fieldset, geopoints) function could accumulate memory.
Macro: added new function for more efficient setting of GRIB keys in one go, rather than one function call per key type (see example below).
Macro: Macro library function mvl_ml2hPa() has been fixed so that it works with GRIB 2 data with pressure levels smaller than 1hPa.
Macro: added new netcdf function setcurrent(netcdf, string) to set the current netcdf variable by name rather than by index
Macro: reduced the number of messages produced when computing zonal means.
Macro: improved the formatting of Macro code automatically generated by the ‘Generate Macro’ button in the Display Window.
Macro Editor: added a new code template to provide an example of setting different output drivers (F4 in the Macro Editor)
Network: fixed issue where the network proxy was always being used, despite the user setting to disable it
Mac: fixed issue where the main menu did not work properly on Mac OS X.
Build: changed the way in which Metview obtains the settings with which Magics was built. This requires at least Magics 2.25.3 to work.
Build: this version of Metview is also released as part of a bundle with Magics, GRIB_API and emoslib for easier installation.
Example of streamlines plotting and subpage clipping
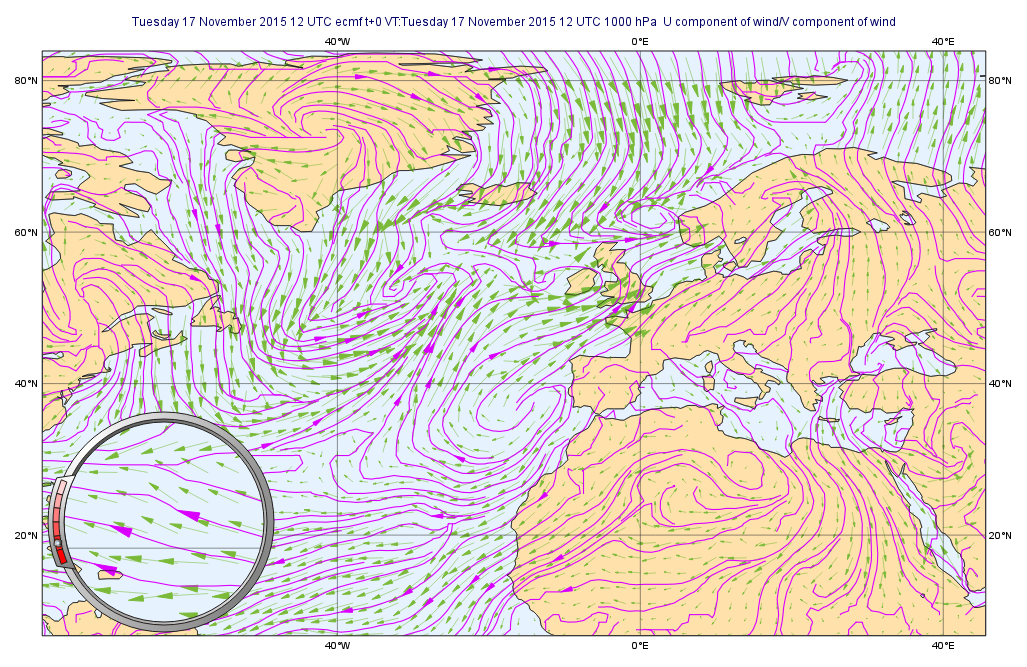
The code to generate this plot is here (click to expand the source):
# Metview Macro
#  **************************** LICENSE START ***********************************
#
#  Copyright 2015 ECMWF. This software is distributed under the terms
#  of the Apache License version 2.0. In applying this license, ECMWF does not
#  waive the privileges and immunities granted to it by virtue of its status as
#  an Intergovernmental Organization or submit itself to any jurisdiction.
#
#  ***************************** LICENSE END ************************************
uv = retrieve(
   levelist : 1000,
   param    : ["u","v"],
   grid     : [1,1]
   )
streamlines = mwind(
   wind_field_type             : "streamlines",
   wind_streamline_min_density : 4,
   wind_streamline_min_speed   : 4,
   wind_streamline_colour      : "bluish_purple",
   wind_streamline_head_shape  : 1
   )
arrows = mwind(
   wind_arrow_colour        : "RGB(0.48,0.73,0.22)",
   wind_arrow_head_shape    : 1,
   wind_arrow_head_ratio    : 0.2,
   wind_arrow_unit_velocity : 15
   )
land_sea_shading = mcoast(
   map_coastline_land_shade        : "on",
   map_coastline_land_shade_colour : "cream",
   map_coastline_sea_shade         : "on",
   map_coastline_sea_shade_colour  : "RGB(0.9,0.95,1)",
   map_grid_latitude_increment     : 20,
   map_grid_longitude_increment    : 40,
   map_grid_colour                 : "charcoal"
   )
view_with_clipping = geoview(
   map_area_definition : "corners",
   area                : [6.71,-78.97,83.91,45.61],
   subpage_clipping    : "on",
   coastlines          : land_sea_shading
   )
plot(view_with_clipping, uv, arrows, streamlines)
Example of new grib_set function
# data types are automatically recognised as string, double or long
data = grib_set (data, ["dataTime", 1500,
                        "identificationOfOriginatingGeneratingCentre", 99,
                        "level", 101,
                        "longitudeOfLastGridPointInDegrees", 300.001,
                        "stepType","avgd"])