Version 5.0 Updates
Version 5.0.3
Externally released on 2018-05-xx
Became metview/new at ECMWF on 2018-05-16 (Linux desktops, ecgate, lxc, lxop)
At ECMWF:
Macro:
added new function to return the subtype of a geopoints variable
MARS:
rebuilt MARS client with ODB support
Hovmoeller:
fixed issue where the Hovmoeller module crashed when processing monthly average analysis data
Plotting:
Fixed issue where the wind barbs were not plotted in a Tephigram (netCDF issue, fixed with Magics 3.0.4)
Fixed issue where the SCM Visualiser crashed (netCDF issue, fixed with Magics 3.0.4)
Portugal is now on the list of countries with administrative borders
fixed crash which occurred in very specific circumstances - if the data is GRIB read from a read() command with a source parameter with a relative path, and the plot() command contains a view definition
Macro Editor:
fixed keyboard shortcuts which had broken: ‘enlarge font’ and ‘indent code’
fixed the status line which indicates the time taken for the macro to run
Installation:
built with Qt4 while we investigate crashes on closedown with Qt5
Version 5.0.2
Became metview/new at ECMWF on 2018-04-18 (Linux desktops, ecgate, lxc, lxop)
At ECMWF:
Macro: fixes for inline C/Fortran
Build: Take into consideration the ENABLE_MEMFS option in ecCodes when computing paths to definition files (when built as the Metview Bundle)
Version 5.0.1
Externally released on 2018-03-01
Became metview/new at ECMWF on 2018-03-05 (Linux desktops, ecgate, lxc, lxop)
At ECMWF:
Plotting:
added new parameter to the Contouring icon to control the number of threads used when computing isolines - can be 1, 4 (default) or 9
it is now possible to drop a Taylor Grid icon into the plot window
Macro:
added new function to return the indexes of the four points surrounding the given location - see the description of surrounding_points_indexes in Fieldset Functions
the vector data type can now be of zero length
new information function is_feature_available() to dynamically test for features available in the current Metview build - see Information Functions
newly created macros now have a .mv extension
fixed issue in the Macro Editor where it did not show output until the end of the macro
Stations:
updated the list of WMO stations used by the Stations module
Installation:
fixed linking problems on Ubuntu
new CMake option -DENABLE_FORTRAN=OFF (default is ON)
environment variable METVIEW_LOCALHOST is now set by default (set to 0 to disable)
startup from the build directory now directly starts Metview without the xserv bar; to invoke the xserv bar, start Metview as “metview -xserv”
optionally, Metview can now be built with ninja instead of make (give the -GNinja option to CMake)
Version 5.0.0 Beta
Externally released on 2017-12-20
Available internally ECMWF via the command “module swap metview/5b” on 2017-12-20 (Linux desktops, ecgate, lxc, lxop)
At ECMWF:
Note
Welcome to the beta release of Metview 5.0! This is very close to what we’d like to release in early 2017, so we’d appreciate testing and feedback. Note that this version requires Magics version 3.0.0.
Highlights
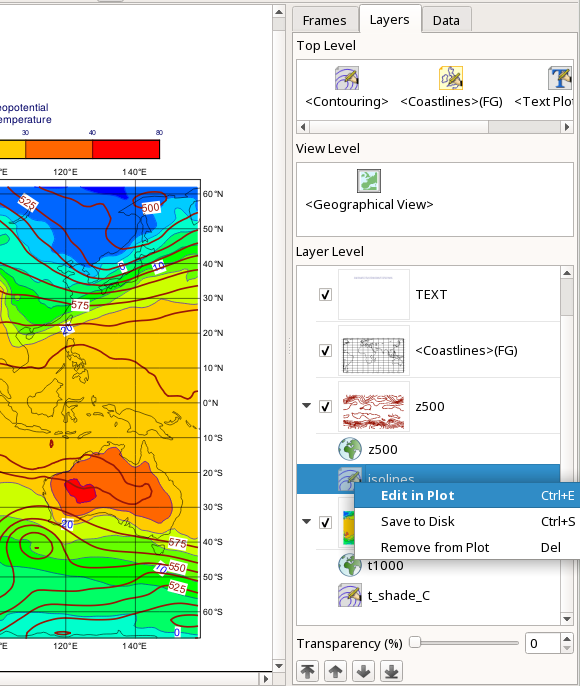
New interactive layer management inside the plot window, allowing for faster plot revisions
Visual definitions can now be dropped directly onto specific layers in the plot window’s sidebar, or even edited directly from within the sidebar! See Layer Management for more.
Per-colour transparency
The colour picker in the icon editors now has support for alpha (opacity) values, and the interactive Display Window now also supports alpha values per colour. In Macro, these are specified as RGBA, e.g. “RGBA(1, 0, 0, 0.8)” for a red colour with 80% opacity (0 is invisible, 1 is full opacity). Note that PostScript output does not support transparency.
# Metview Macro

#  **************************** LICENSE START ***********************************
#
#  Copyright 2017 ECMWF. This software is distributed under the terms
#  of the Apache License version 2.0. In applying this license, ECMWF does not
#  waive the privileges and immunities granted to it by virtue of its status as
#  an Intergovernmental Organization or submit itself to any jurisdiction.
#
#  ***************************** LICENSE END ************************************

# retrieve simulated satellite image
simsat = retrieve(
   type       : "ssd",
   expver     : 0001,
   param      : 260510,
   date       : -3,
   step       : 0,
   channel    : 9,
   ident      : 57,
   instrument : 207
   )

# retrieve precipitation
tp = retrieve(
   type    : "pf",
   stream  : "ef",
   levtype : "sfc",
   param   : "tp",
   date    : -3,
   step    : 6,
   number  : "all",
   grid    : [0.5,0.5]
   )

prob_tp = mean(tp > 0.005) * 100 # probability of > 5mm of precipitation

sat_shade = mcont(
   legend                         : "on",
   contour                        : "off",
   contour_level_count            : 20,
   contour_label                  : "off",
   contour_shade                  : "on",
   contour_shade_technique        : "cell_shading",
   contour_shade_cell_resolution  : 40,
   contour_shade_cell_method      : "interpolate",
   contour_shade_max_level_colour : "black",
   contour_shade_min_level_colour : "white",
   contour_shade_colour_direction : "clockwise"
   )

tp_prob_shade = mcont(
   legend                       : "on",
   contour                      : "off",
   contour_level_selection_type : "level_list",
   contour_level_list           : [5,20,40,60,80,95,105],
   contour_label                : "off",
   contour_shade                : "on",
   contour_shade_colour_method  : "list",
   contour_shade_method         : "area_fill",
   contour_shade_colour_list    : ["RGBA(0.48,0.82,0.78,0.38)",
                                    "RGBA(0.42,0.79,0.27,0.38)",
                                    "RGBA(0.83,0.85,0.2,0.38)",
                                    "RGBA(0.9,0.64,0.23,0.38)",
                                    "RGBA(0.97,0.43,0.43,0.38)",
                                    "RGBA(1,0.0039,1,0.38)"]
   )

coastlines = mcoast(
   map_coastline_colour    : "RGB(0.97,0.94,0.41)",
   map_coastline_thickness : 2,
   map_grid_colour         : "RGB(0.95,0.92,0.69)"
   )

plot(simsat, sat_shade, prob_tp, tp_prob_shade, coastlines)
Editor |
Plot |
Macro |
||
|---|---|---|---|---|
|
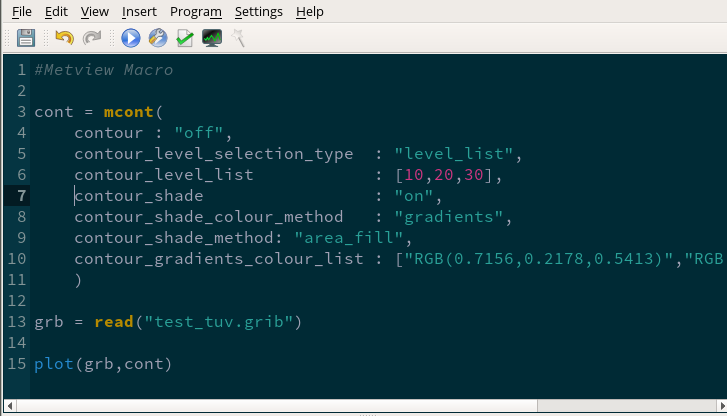
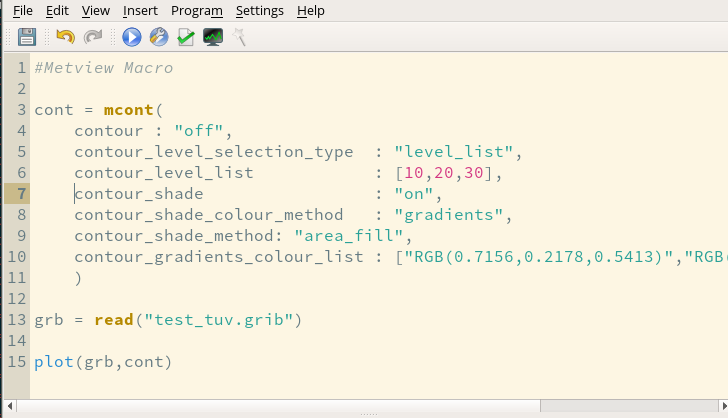
New colour gradients shading option
New options were added to the Contouring icon, facilitating more powerful colour scales within a single Contouring definition. Please see How to use the colour gradient editor for more information on this feature. More examples will be added to the Gallery!
# Metview Macro

#  **************************** LICENSE START ***********************************
#
#  Copyright 2015 ECMWF. This software is distributed under the terms
#  of the Apache License version 2.0. In applying this license, ECMWF does not
#  waive the privileges and immunities granted to it by virtue of its status as
#  an Intergovernmental Organization or submit itself to any jurisdiction.
#
#  ***************************** LICENSE END ************************************

# read the input grib file
my_data = read("t850.grb")

#set up the contours
my_contour = mcont(
   legend                            : "on",
   contour                           : "off",
   contour_level_selection_type      : "level_list",
   contour_level_list                : [-40,-20,0,20,40],
   contour_gradients_step_list       : 10,
   contour_label                     : "off",
   contour_shade                     : "on",
   contour_shade_colour_method       : "gradients",
   contour_gradients_technique       : "rgb",
   contour_shade_method              : "area_fill",
   contour_gradients_colour_list     : ["RGB(0.01961,0.251,0.4157)","greenish_blue","white","orangish_red","RGB(0.3756,0.06648,0.05582)"],
   contour_gradients_waypoint_method : "ignore"
   )

# set up the coastlines
my_coast = mcoast(map_coastline_colour            : "charcoal",
                  map_coastline_resolution        : "medium",
                  map_coastline_thickness         : 2,
                  map_coastline_land_shade        : "off",
                  map_coastline_land_shade_colour : "RGB(0.25,0.25,0.25)",
                  map_coastline_sea_shade         : "off",
                  map_grid_line_style             : "dash",
                  map_grid_colour                 : "charcoal"
)

# set up the geographical view
my_view = geoview(map_area_definition : "corners",
                  map_projection      : "cylindrical",
                  area                : [20.00,-20.00,70.00,50.00],
                  coastlines          : my_coast)

# set-up the title
my_title = mtext(text_font_size     : 0.6,
               text_lines         : ["Gradients technique for shading",
                                       "Computing a range of colours with 5 waypoints given as level list",
                                       "<font colour='evergreen'>contour_level_list                      : [-40,-20,0,20,40]</font>",
                                       "<font colour='evergreen'>contour_gradients_step_list     : 10 </font>",
                                       "<font colour='red'>10</font> colours between each 2 waypoints"],
               text_justification : "left",
               text_colour        : "charcoal")

# set up a legend for the field
my_legend = mlegend(legend_text_colour    : "charcoal",
                  legend_text_font_size : 0.35,
                  legend_display_type   : "continuous",
                  legend_box_mode       : "positional",
                  legend_box_x_position : 25.00,
                  legend_box_y_position : -1.00,
                  legend_box_x_length   : 3.00,
                  legend_box_y_length   : 17.50)


# plot the data onto the map
plot(my_view, my_data, my_contour, my_legend, my_title)
Plot |
Editor |
Code |
Data |
||
|---|---|---|---|---|---|
|
`visibil ity.grib
//conflu ence.ecm wf.int/d ownload/ attachme nts/9231 0567/vis ibility. grib?api =v2&modi fication Date=151 37831866 19&versi on=1>`__ |
||||
|
FLEXPART support added
A new interface was developed for the FLEXPART Lagrangian particle dispersion model. The FLEXPART interface page gives an overview about the installation and setup of FLEXPART and also serves as a hub to access the icon documentation and the FLEXPART tutorial.
Macro Editor has new colour schemes
The Macro Editor has introduced two new colour schemes: solarized dark and solarized light. The colour scheme can be selected from the Settings -> Colour Scheme menu. The original colour scheme is called Metview and is kept as default.
Other features of Metview 5
Plotting:
added MImport icon for adding image files to a plot (this only partially worked in the past)
enabled line and symbol properties to be changed when in AREA mode in the Graph Plotting icon
added new parameter Map Cities Text Blanking to the Coastlines icon
added new parameters to draw a frame around the edge of the grid in the Coastlines icon, for selected projections that do not fill the page
added the ability to plot horizontal bar charts via the new Graph Bar Orientation parameter in the Graph Plotting icon
fixed issue where plotting a curve via the Table Visualiser did not work when the output was to file
fixed issue where the Macro code generated by the Generate Macro function in the Display Window produced incorrect code for the Simple Formula icon
the default output file format has been changed from PostScript to PDF
the behaviour of Text Plotting icons (mtext() in Macro) has changed slighly - see the Metview FAQ - old for details of this and how to compensate for it
Macro:
improved handling of netCDF data when the current variable is time-based - see NetCDF. Note that this is a change in behaviour, and existing macros may have to be revised.
improved handling of netCDF data where a computation could lead to the overflow of the storage data type - see NetCDF. Note that this is a change in behaviour, and existing macros may have to be revised.
improved handling of netCDF data where the current variable has scale_factor and add_offset attributes - these are now automatically applied - see NetCDF. Note that this is a change in behaviour, and existing macros may have to be revised.
added a macro library function to draw a circle with a given radius in km onto a map - mvl_geocircle()
fixed problem where the valid_date() function could give the wrong result given data with a very large step
fixed problem where a Macro operation on a netCDF variable could overwrite the original file if it is a symbolic link
change in behaviour: the grib_get_xxx() functions now return nil if the given key is not found
change in behaviour: when indexing a vector like this: v[a,a], i.e. two indexes the same, the result will be a single-element vector; the previous behaviour was to return a number
ensure that an incorrect indexing of a fieldset variable returns an error
ensure that an incorrect indexing of a geopoints variable returns an error
Vertical Profile: removed the redundant option Area 2 from Input Mode; please use Area instead, as it is identical
FLEXTRA:
the default value for the FLEXTRA Area parameter changed in the FLEXTRA Prepare - old icon. The new default is: -90/-179/90/180.
fixed issue where FLEXTRA did not properly handle global GRIB 2 fields
it is now possible to specify a relative path for FLEXTRA Input Path in the FLEXTRA Run icon
a new FLEXTRA page was created in confluence providing an overview about the installation, setup and use of the FLEXTRA interface.
the FLEXTRA tutorial has been moved to Confluence
Macro Editor:
revised which actions are available via the toolbar, providing a cleaner interface
settings are now saved immediately (font size, show line numbers, theme)
GRIB:
it is now possible, with care, to handle and plot very large GRIB fields (e.g. 1km global) - see Visualising large data files with Metview
GRIB Examiner now correctly displays the sections of a GRIB 3 file
Desktop:
new icon context menu action called “Delete” (shortcut is Shift+Delete). With this action the icon is deleted permanently (not moved to the wastebasket).
new icon context menu action called “Copy filesystem path” to copy an icon’s path to the clipboard
selecting Log from the menu raises the existing log window if it is open
added action in the Go menu to navigate to the Defaults folder
Metview no longer asks for confirmation when closing down, unless there are multiple windows
the Log window now uses a monospaced font for easier reading of aligned text
improved the process of renaming icons from the user interface (when we edit the icon name the whole text is automatically selected; pressing enter in the text editor or clicking outside the icon confirms the renaming)
fixed issue where the Desktop could get into a bad state if an opened folder is moved, or if Metview is started on a system that cannot see a folder that was open when Metview was last closed
Startup: fixed issue when starting Metview for the first time on a system where there is a pre-existing directory called metview
Qt: Metview now looks for Qt5 by default. To build with Qt4 (still supported for the time being, please build with -DENABLE_QT5=OFF)
Motif: completely removed the old Motif-based user interface from Metview’s source code