Version 5.10 Updates
Version 5.10.2
Externally released on 2021-01-20
Became metview/new at ECMWF on 2021-01-20 (Linux desktops, ecgate, lxc, lxop)
At ECMWF:
Hovmoeller:
fixed issue where the Hovmoeller module’s ‘expand’ option did not work
Plotting:
fixed issue that caused a crash when plotting a tephigram using the Stations module for location input
Macro:
fixed issue where a Geopointset could not be loaded if the format of the underlying Geopoints was NCOLS
fixed issue where a fieldset with one or more modified fields was added to a definition and could not then be plotted
performance optimisation in the lookup function - see Fieldset Functions
Gallery:
added examples using the Cartesian View
changed the default language to Python
Build:
fixed issue where Metview could not build with a curl library installed into a non-standard location
FORTRAN is now disabled by default
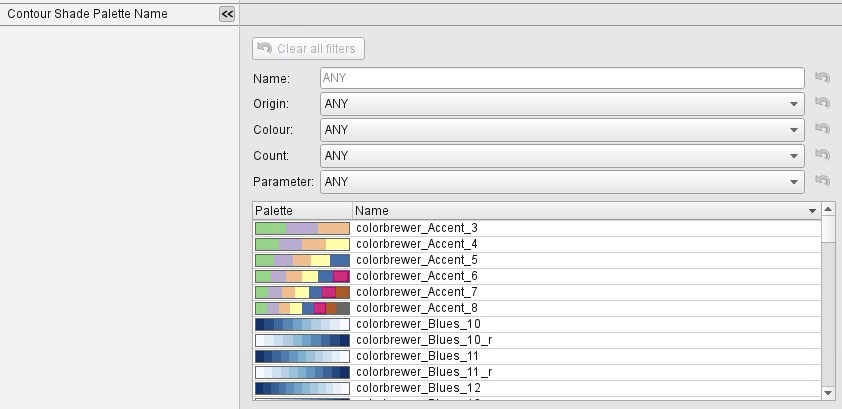
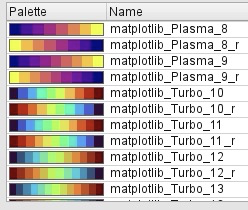
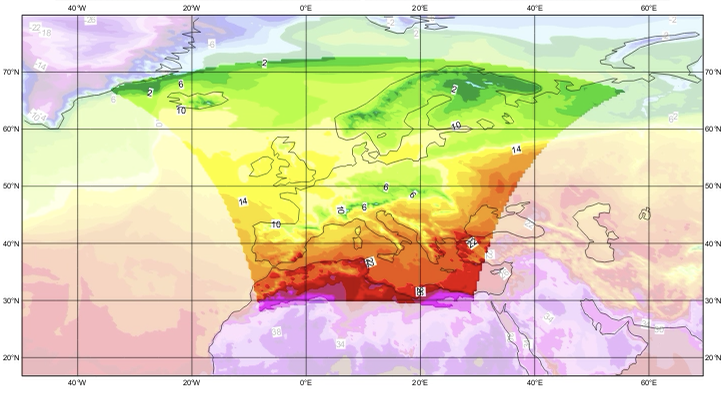
Built with Magics 4.5.3, the new palettes are available to browse and use in the Contouring icon:
Version 5.10.1
Externally released on 2020-11-09
Became metview/new at ECMWF on 2020-11-09 (Linux desktops, ecgate, lxc, lxop)
At ECMWF:
Plotting:
fixed issue where custom symbol images (Symbol Plotting - Symbol Marker Mode = ‘image’) were plotted at slightly different positions depending on the graphics driver - when producing a file such as PNG, PDF or PostScript the marker images were centred on the supplied locations; in the interactive plotting window, the locations were taken to be the South-West corner of the marker. Now the interactive window follows the same rule as the other drivers and centres the markers on the locations. Requires Magics 4.5.1.
example: plot an image covering a 10x10 degree square at location (0, 0). Previously, the interactive plot would look like the one on the left, now it looks the one on the right, which is consistent with the other drivers:
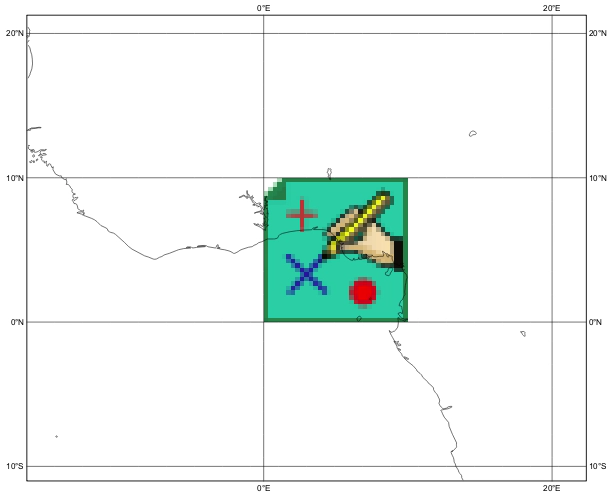
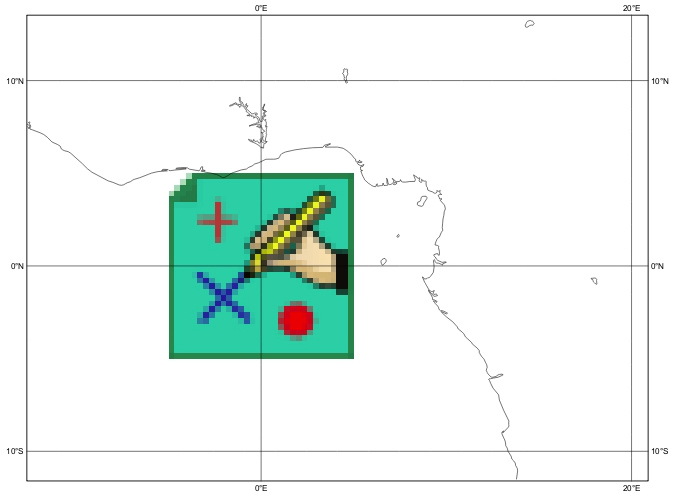
# Metview Macro

ivis = input_visualiser(
   input_plot_type        : "geo_points",
   input_longitude_values : 0,
   input_latitude_values  : 0,
   input_values           : 10
   )

symb = msymb(
   symbol_type         : "marker",
   symbol_height       : 0.6,
   symbol_marker_mode  : "image",
   symbol_image_path   : "./MSYMB.png",
   symbol_image_format : "png",
   symbol_image_width  : 10,
   symbol_image_height : 10
   )

plot(ivis, symb)
benefits from a fix in Magics 4.5.1 where cross sections that cross a pole did not plot properly
fixed issue where the version of Magics was not displayed in the Help | About box
Geopoints:
fixed issue where geopoints station ids (
stnids()) could return numbers instead of strings if the station ids were ‘numeric’ in nature, e.g. ‘12345’. Now they are always returned as strings.
Macro:
fixed issue where vector variables written to disk could not be read back into memory on some platforms
Startup:
fixed issue where directory permissions were not correctly set when starting Metview for the very first time, causing an ability to start Metview
Build:
fixed issue when building for macOS on conda
fixed issue where a data file used for tests was not available
Version 5.10.0
Externally released on 2020-10-15
Became metview/new at ECMWF on 2020-10-15 (Linux desktops, ecgate, lxc, lxop)
At ECMWF:
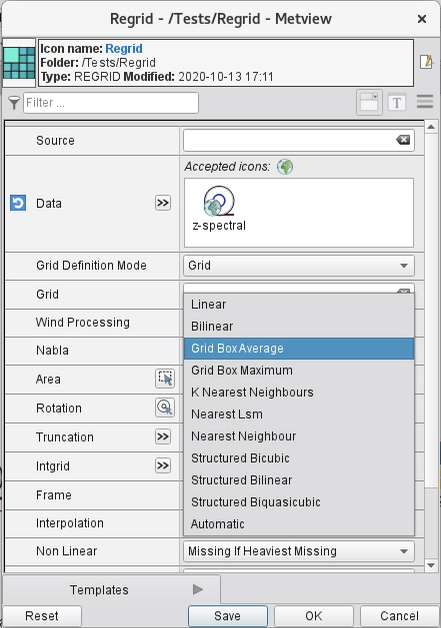
GRIB Regridding:
new module - Regrid - providing powerful and flexible interpolation and processing methods on GRIB data. Supports many configurable interpolation methods, output to various grid types including rotated grids and Lambert variants, supports nabla operators, and processing such as spectral to gridpoint, sub-area extraction, frame carving and changing the bits-per-value. The module also allows a template GRIB to be supplied, circumventing the need to set any output grid parameters. The most common of these parameters are already available through the MARS Retrieval and GRIB Filter icons - Regrid takes it to the next level!
Note
In this release, the Regrig module is considered to be a beta release, meaning that we may make small changes to the interface in upcoming releases; we welcome feedback.
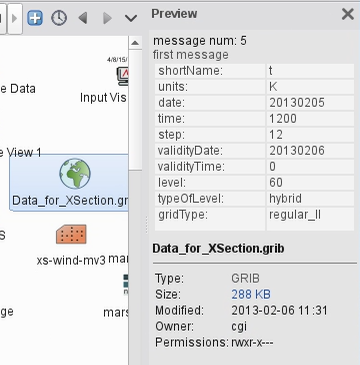
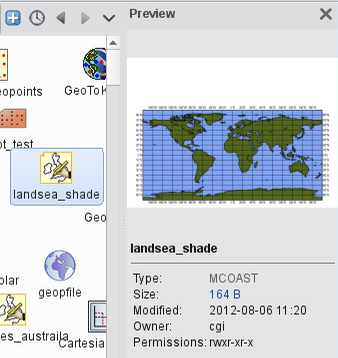
User Interface:
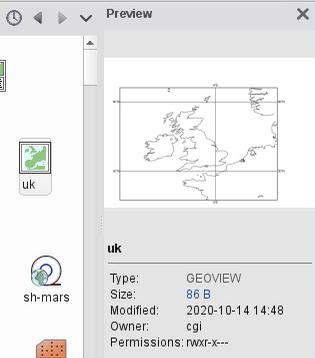
added a Preview panel in the main user interface:
activated via the ‘eye’ icon in the toolbar:

now, when the mouse cursor is over an icon, you see some information about it in the Preview panel, e.g. for data icons you will see some meta-data, for Coastlines and Geographical View icons, you will see a plot preview:
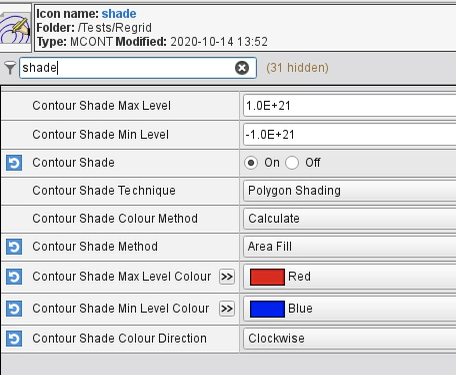
added a parameter filter to the icon editors to speed up the finding of parameters:
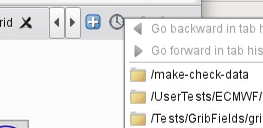
added a tab history navigation tool
added a search capability to the getCapabilities view of the WMS Client editor
redesigned icons for graphical output types for clarity, e.g.

Old icon style

New icon style
fixed issue where the help sidebar in the Code Editor could not be restored after it had been collapsed using the splitter handle
fixed issue where an icon editor could be closed unintentionally when pressing a key
fixed issues on macOS 10.15 where no more than one instance of various modules (e.g. Code Editor, GRIB Examiner, batch plotting) could be run simultaneously
fixed issue on macOS where closing an icon editor’s Help widget could cause a crash
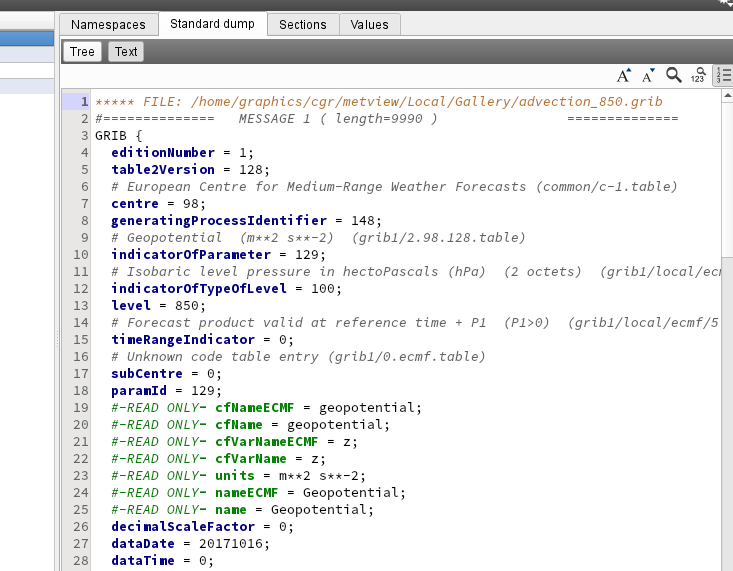
GRIB Examiner:
added syntax highlighting to GRIB dump text
Plotting:
added option to render Thermo Grid to background or foreground layer
fixed issue where the Table Visualiser could plot “geo_vector” data at the wrong locations
fixed issue in the Contouring icon where parameter contour_hilo_format was not available if contour_hilo_type was set to BOTH
Macro / Python:
added function to compute xy components from polar components:
xy_from_polar()added function to generate orography polygon for cross section:
xs_build_orog()added function to generate curve from a field for cross section:
xs_build_curve()added function to extract data values from thermo data objects:
thermo_data_values()added function to create a geographic polyline object:
mvl_geopolyline()add convenience function to generate xy area plot objects:
xy_area()add function to compute vertical velocity from omega:
w_from_omega()added function to compute dewpoint from specific humidity:
dewpoint_from_specific_humidity()added function to compute dewpoint from relative humidity:
dewpoint_from_relative_humidity()added an option to the
indexes()function to allow interpolation between indexesenabled
ml_to_hl()to work with target heights defined by fieldsetsenabled
vapour_pressure()to work with model levels fieldsrenamed function
geostrophic_wind_pl()togeostrophic_wind()switched off unnecessary printouts when reading BUFR data through Python
fixed issue that Metview did not fail when dividing one field by another that contains zeros
fixed issue where the
pressure()function did not set paramId to 54 on output field
Geopoints:
handle the case where a station id contains internal spaces
fixed issue where invalid latlon values in geopoints would make the geopoints-grib operator crash
fixed issue where Observation Filter did not set missing values correctly for geopoints output
fixed issue where the Geopoints format string was not set for traditional type when loaded from file
Cross section:
added option to perform vertical extrapolation when vertical_coordinates=”user”. The new option name is VERTICAL_COORDINATE_EXTRAPOLATE. The possible values are on and off. See Cross Section Data
Hovmoeller:
fixed issue where parameter time_axis_mode was not respected when run from Macro/Python
ODB support:
Metview is now built with the odc library, which replaces ODB_API; functionality remains unchanged
Startup:
the ‘examine’ startup mode no longer requires the data type to be specified - see Metview’s Startup Options
Geopoints are now supported in Metview’s ‘examiner’ startup mode
fixed an issue where a user’s initial Metview directory was read-only
fixed an issue where macOS machines could not untar some system files needed for the users’ initial directory, leading either to: untidy startup folder, or unable to untar and build the source
Build:
note that this version of Metview requires CMake 3.12.0+, ecCodes 2.19.0+ and Magics 4.5.0+.
Gallery:
added a new example for ensemble data handling:
added new examples for cross section:
added a new example for plotting ODB data onto a tephigram:
added a new example for plotting polylines/polygons into arbitrary map projections: